Getting Started
12 Jun 202318 minutes to read
This section explains briefly about how to create Maps in your application with ASP.NET Core.
Create your first Map in Core
You can configure an Essential ASP.NET Core 1.0 Map with simple steps. In this example, you can learn how to configure USA population map with customized appearance and tooltip.
Create a simple Core Application
To begin, create a new ASP.NET Core project Web application.
Preparing Shape Data
The Shape Data collection describing geographical shape information can be obtained from GEOJSON format shapes.
In this example, USA shape is used as shape data by utilizing the United States of America.json file in the following folder structure obtained from downloaded Maps_GeoJSON folder.
..\ Maps_GeoJSON\All Countries with States
You can store the United States of America.json file in data folder as usa.json. Then read the complete contents in “usa.json” file and assign to new MapData object in “MapController.cs” in the following folder location,
~/Controller/MapController.cs
public IActionResult Map()

	{
		ViewData["mapData"] = GetUSMap();

		ViewData["datasource"] = GetUSPopulationData();

		return View();

	}

	public object GetUSMap()

	{

		string data = System.IO.File.ReadAllText(@"..\data\USA.json");

		return new Syncfusion.JavaScript.DataVisualization.Maps.MapData(data);

	}
Prepare Data Source
The dataSource is populated with USA population data inside the controller relative to shape data. For better understanding, “MapController.cs” is populated with data of USA Population in “MapController.cs”.
public IActionResult Map()

	{
		ViewBag.mapData = GetUSMap();

		ViewBag.datasource = GetUSPopulationData();

		return View();

	}

	public object GetUSMap()

	{

		string data = System.IO.File.ReadAllText(@"..\data\USA.json");

		return new Syncfusion.JavaScript.DataVisualization.Maps.MapData(data);

	}


	public List<CountyPopulationData> GetUSPopulationData()

	{

		List<CountyPopulationData> populationData = new List<CountyPopulationData>

		{

			new CountyPopulationData(){ Name= "California", Population=38332521},

			new CountyPopulationData(){ Name= "Texas", Population=26448193},

			new CountyPopulationData(){ Name= "New York", Population=19651127},

			new CountyPopulationData(){ Name= "Florida", Population=19552860},

			new CountyPopulationData(){ Name= "Illinois", Population=12882135},

			new CountyPopulationData(){ Name= "Pennsylvania", Population=12773801},

			new CountyPopulationData(){ Name= "Ohio", Population=11570808},

			new CountyPopulationData(){ Name= "Georgia", Population=9992167},

			new CountyPopulationData(){ Name= "Michigan", Population=9895622},

			new CountyPopulationData(){ Name= "North Carolina", Population=9848060},

			new CountyPopulationData(){ Name= "New Jersey", Population=8899339},

			new CountyPopulationData(){ Name= "Virginia", Population=8260405},

			new CountyPopulationData(){ Name= "Washington", Population=6971406},

			new CountyPopulationData(){ Name= "Massachusetts", Population=6692824},

			new CountyPopulationData(){ Name= "Arizona", Population=6626624},

			new CountyPopulationData(){ Name= "Indiana", Population=6570902},

			new CountyPopulationData(){ Name= "Tennessee", Population=6495978},

			new CountyPopulationData(){ Name= "Missouri", Population=6044171},

			new CountyPopulationData(){ Name= "Maryland", Population=5928814},

			new CountyPopulationData(){ Name= "Wisconsin", Population=5742713},

			new CountyPopulationData(){ Name= "Minnesota", Population=5420380},

			new CountyPopulationData(){ Name= "Colorado", Population=5268367},

			new CountyPopulationData(){ Name= "Alabama", Population=4833722},

			new CountyPopulationData(){ Name= "South Carolina", Population=4774839},

			new CountyPopulationData(){ Name= "Louisiana", Population=4625470},

			new CountyPopulationData(){ Name= "Kentucky", Population=4395295},

			new CountyPopulationData(){ Name= "Oregon", Population=3930065},

			new CountyPopulationData(){ Name= "Oklahoma", Population=3850568},

			new CountyPopulationData(){ Name= "Puerto Rico", Population=3615086},

			new CountyPopulationData(){ Name= "Connecticut", Population=3596080},

			new CountyPopulationData(){ Name= "Iowa", Population=3090416},

			new CountyPopulationData(){ Name= "Mississippi", Population=2991207},

			new CountyPopulationData(){ Name= "Arkansas", Population=2959373},

			new CountyPopulationData(){ Name= "Utah", Population=2900872},

			new CountyPopulationData(){ Name= "Kansas", Population=2893957},

			new CountyPopulationData(){ Name= "Nevada", Population=2790136},

			new CountyPopulationData(){ Name= "New Mexico", Population=2085287},

			new CountyPopulationData(){ Name= "Nebraska", Population=1868516},

			new CountyPopulationData(){ Name= "West Virginia", Population=1854304},

			new CountyPopulationData(){ Name= "Idaho", Population=1612136},

			new CountyPopulationData(){ Name= "Hawaii", Population=1404054},

			new CountyPopulationData(){ Name= "Maine", Population=1328302},

			new CountyPopulationData(){ Name= "New Hampshire", Population=1323459},

			new CountyPopulationData(){ Name= "Rhode Island", Population=1051511},

			new CountyPopulationData(){ Name= "Montana", Population=1015165},

			new CountyPopulationData(){ Name= "Delaware", Population=925749},

			new CountyPopulationData(){ Name= "South Dakota", Population=844877},

			new CountyPopulationData(){ Name= "Alaska", Population=735132},

			new CountyPopulationData(){ Name= "North Dakota", Population=723393},

			new CountyPopulationData(){ Name= "District of Columbia", Population=646449},

			new CountyPopulationData(){ Name= "Vermont", Population=626630},

			new CountyPopulationData(){ Name= "Wyoming", Population=582658}

		};

		return populationData;

	}


	public class CountyPopulationData

	{

		public string name;

		public string Name

		{

			get { return name; }

			set { name = value; }

		}

		public double population;


		public double Population

		{

			get { return population; }

			set { population = value; }

		}

	}
Initialize Map
- Create a <div> tag and set the height and width to determine the map size.
<div style="width: 900px; height: 600px;"></div>- Add the following code sample in “Map.cshtml” file, to create the Map control in the View page.
<div style="height:600px;width:900px;">
<ej-map id="maps">
<e-layers>
<e-layer shape-data="ViewBag.mapData">
</e-layer>
</e-layers>
</ej-map>
</div>
The above code renders a map with default properties and shape input provided through data in layers.
Data Binding in Map
The following properties in shape layers is used for binding data in Maps control.
- DataSource
- ShapeDataPath
- ShapePropertyPath
DataSource
The datasource property accepts the collection values as input. For example, you can provide the list of objects as input.
Shape Data Path
The shape-data-path property is used to refer the data ID in DataSource. For example, population MapData contains data ids ‘Name’ and ‘Population’. The shape-data-path and the shape-property-path properties are related to each other (refer to shape-property-path for more details).
Shape Property Path
The shape-property-path property is similar to the shape-data-path that refers to the column name in the data property of shape layers to identify the shape. When the values of the shape-data-path property in the datasource property and the value of ` shape-property-path in the Data` property match, then the associated object from the DataSource is bound to the corresponding shape.
<div style="height:600px;width:900px;">
<ej-map id="maps">
<e-layers >
<e-layer shape-data-path="name" shape-property-path="name" shape-data="ViewBag.shapeData"
datasource="ViewBag.datasource">
</e-layer>
</e-layers>
</ej-map>
</div>
Customize Map Appearance
You can customize the shape’s color by using fill, stroke and stroke-thickness properties in shape-settings.
<ej-map id="maps">
<e-layers >
<e-layer  shape-data-path="mapData" enable-mouse-hover="true" >
<e-shape-settings  highlight-color="#BC5353" stroke-thickness="0.5"
stroke="white" highlight-stroke="white" fill="#9CBF4E"
highlight-border-width="1">
</e-shape-settings>
</e-layer>
</e-layers>
</ej-map>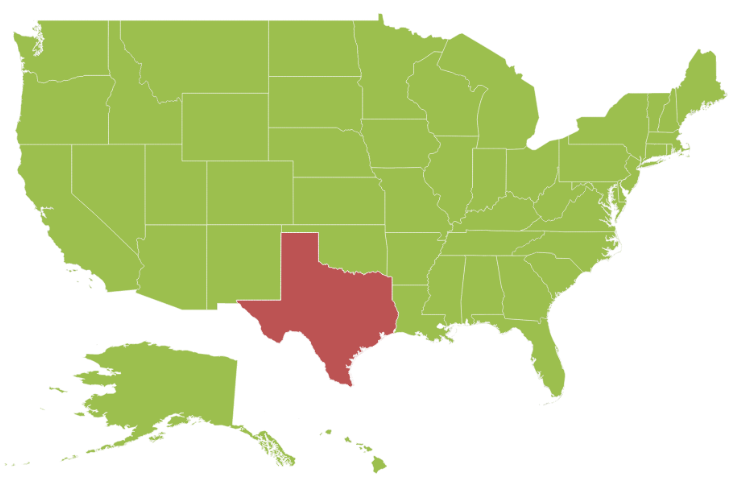
Customizing Map Appearance by Range
The Range color mapping is used to differentiate the shape’s fill based on its underlying value and color ranges. The from and to properties defines the value ranges and the gradient-colors property defines the equivalent color ranges respective to their value ranges.
NOTE
The
enable-gradientproperty value should be true to apply gradient colors for maps.
<div style="height:600px;width:900px;">
<ej-map id="maps">
<e-layers >
<e-layer shape-data-path="name" shape-property-path="name" shape-data="ViewBag.shapeData"
datasource="ViewBag.datasource" show-map-items="false" enable-selection="false" enable-mouse-hover="true">
<e-shape-settings stroke="white" fill="#9CBF4E" value-path="population" enable-gradient="true"
stroke-thickness="0.5" highlight-stroke="white" highlight-color="#BC5353" highlight-border-width="1">
</e-shape-settings>
</e-layer>
</e-layers>
</ej-map>
</div>
<script>
$("document").ready(function () {
var mapObj = $("#maps").data("ejMap");
mapObj.model.layers[0].shapeSettings.colorMappings =
{rangeColorMapping: rangeColorMapping: [
{
from: 500000,
to: 1000000,
gradientColors: ["#9CBF4E", "#B8CE7B"]
},
{
from: 1000001,
to: 5000000,
gradientColors: ["#B8CE7B", "#CBD89A"]
},
{
from: 5000001,
to: 10000000,
gradientColors: ["#CBD89A", "#DEE2B9"]
},
{
from: 10000001,
to: 40000000,
gradientColors: ["#DEE2B9", "#F1ECD8"]
}]
};
$("#maps").ejMap("refresh");
});
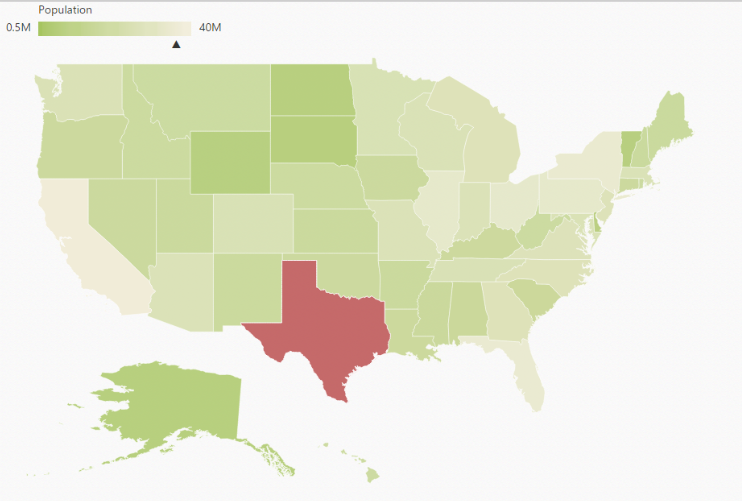
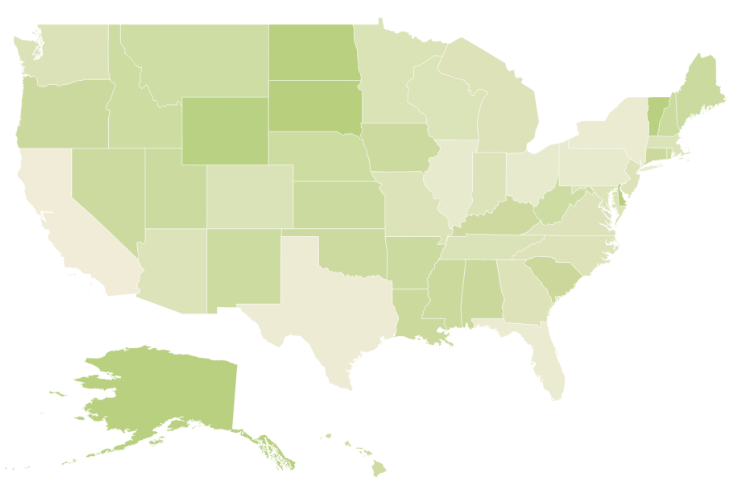
</script>The following screenshot illustrates a Map with gradient color property enable.
Enable Tooltip
The tooltip is displayed only when show-tooltip is set to ‘True’ in the shape layers. By default, it takes the property of the bound object that is referred in the value-path and displays its content on hovering the corresponding shape. The tooltip-template property is used for customizing the template for tooltip.
<div style="height:600px;width:900px;">
<ej-map id="maps">
<e-layers >
<e-layer show-tooltip="true">
<e-shape-settings value-path="name">
</e-shape-settings>
</e-layer>
</e-layers>
</ej-map>
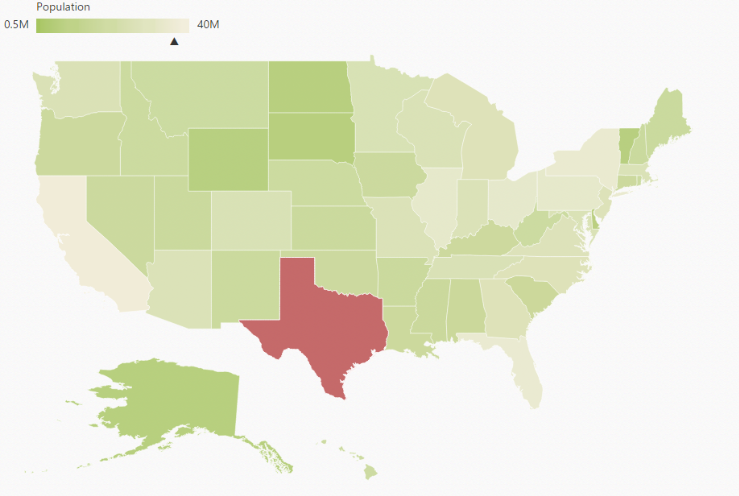
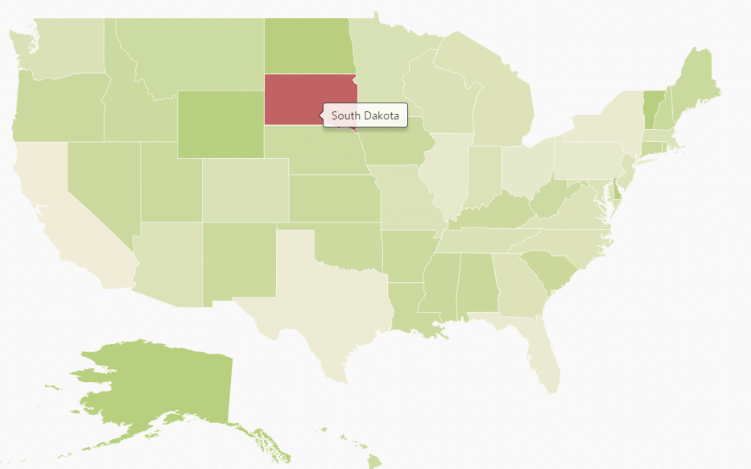
</div>The following screenshot illustrates a map control displaying a Tooltip.
Legend
A Legend can be made visible by setting the ShowLegend property in LegendSetting.
Interactive Legend
The legends can be made interactive with an arrow mark indicating the exact range color in the legend, when the mouse hovers the corresponding shapes. You can enable this option by setting Mode property in LegendSettings value as ‘Interactive’. The default value of Mode property is ‘Default’ to enable the normal legend.
Title
Use Title property to provide title for interactive legend.
Label
You can use left-label and right-label property to provide left and right labels for interactive legend.
<div style="height:600px;width:900px;">

<ej-map id="maps">
<e-layers >
<e-layer shape-data-path="name" shape-property-path="name" shape-data="ViewBag.shapeData"
datasource="ViewBag.datasource" show-map-items="false" enable-selection="false" enable-mouse-hover="true">
<e-shape-settings   stroke="white" fill="#9CBF4E" value-path="population" enable-gradient="true"
stroke-thickness="0.5" highlight-stroke="white" highlight-color="#BC5353" highlight-border-width="1">
</e-shape-settings>
<e-legend-settings show-legend="true" height="15" width="150" position="@DockPosition.TopLeft"
type="@LegendType.Layers" mode="@LegendMode.Interactive" title="population" left-label="0.5M" right-label="40M"></e-legend-settings>
</e-layer>
</e-layers>
</ej-map>
</div>

<script>
   $("document").ready(function () {
           var mapObj = $("#maps").data("ejMap");
           mapObj.model.layers[0].shapeSettings.colorMappings =
            {rangeColorMapping: rangeColorMapping: [
                        {
                            from: 500000,
                            to: 1000000,
                            gradientColors: ["#9CBF4E", "#B8CE7B"]
                        },
                        {
                            from: 1000001,
                            to: 5000000,
                            gradientColors: ["#B8CE7B", "#CBD89A"]
                        },
                        {
                            from: 5000001,
                            to: 10000000,
                            gradientColors: ["#CBD89A", "#DEE2B9"]
                        },
                        {
                            from: 10000001,
                            to: 40000000,
                            gradientColors: ["#DEE2B9", "#F1ECD8"]
                        }]
             };
           $("#maps").ejMap("refresh");

       });

</script>
The following screenshot illustrates a map displaying an interactive legend.