How can I help you?
Node
Nodes are graphical object that represent visual data to be placed on the page.
Create Node
A node can be created and added to the Diagram, either programmatically or interactively. Nodes are stacked on the Diagram area from bottom to top in the order they are added.
Add node through nodes collection
To create a node, You have to create the node object and add that to Nodes collection of the Diagram Model. The following code example illustrates how to add a node to the Diagram.
<ej-diagram id="diagram" width="900px" height="600px">
        <e-nodes>
          <e-node name="node1" width="100" height="100" offset-X="250" offset-Y="250" fill-color="darkcyan" border-width="2"></e-node>
        </e-nodes>
    </ej-diagram>
Add node at runtime
Nodes can be added at runtime by using public method, add. The following code illustrates how to add a node.
// Defines JSON to create a node
    var node = {
        name: "node1",
        width: 100,
        height: 100,

        //Sets position
        offsetX: 250,
        offsetY: 250,
        fillColor: "darkcyan",
        borderWidth: 2
    };

    var diagram = $("#diagram").ejDiagram("instance");

    // Adds node to the Diagram
    diagram.add(node);
Add node from palette
Nodes can be predefined and added to palette and can be dropped into the Diagram when needed. For more information about adding nodes from symbol palette, refer to Symbol Palette.
Create node through data source
Nodes can be generated automatically with the information provided through data source. The default properties for these nodes are fetched from default settings. For more information about data source, refer to Data Binding.
Draw nodes
Nodes can be interactively drawn by clicking and dragging the Diagram surface by using DrawingTool. For more information about drawing nodes, refer to Draw Nodes.
Update Node at runtime
The client side method updateNode is used to update the nodes at run time. The following code example illustrates how to update a node at runtime.
var diagram = $("#DiagramContent").ejDiagram("instance");
    diagram.updateNode("nodeName", {
        fillColor: "#1BA0E2",
        borderWidth: 5,
        borderColor: "#000000"
    })
Position
Position of a node is controlled by using its OffsetX and OffsetY properties. By default, these offset properties represent the distance between origin of the Diagram’s page and node’s center point. You may expect this Offset values to represent the distance between page origin and node’s top left corner instead of center. Pivot property helps solve this problem. Default value of node’s Pivot point is (0.5, 0.5), that means center of Node.
The following table illustrates how pivot relates offset values with node boundaries.
| Pivot | Offset |
|---|---|
| (0.5,0.5) | OffsetX and OffsetY values are considered as the node’s center point. |
| (0,0) | OffsetX and OffsetY values are considered as the top left corner of node |
| (1,1) | OffsetX and OffsetY values are considered as the bottom right corner of the node. |
The following code illustrates how to change the Pivot value.
<ej-diagram id="diagram" width="900px" height="600px">
       <e-nodes>
         <e-node name="node1" width="100" height="50" offset-X="100" offset-Y="100">
            <e-pivot x="0" y="0"></e-pivot>
         </e-node>
       </e-nodes>
    </ej-diagram>
Types
Diagram allows to add different kind of nodes. To explore the types of nodes, refer to Types of Nodes.
Appearance
You can customize the appearance of a node by changing its font, fill colors, patterns, line weight and style, or shadow. The following code illustrates how to customize the appearance of the shape.
<ej-diagram id="diagram" width="900px" height="600px">
      <e-nodes>
        <e-node name="node1" width="100" height="100" offset-X="100" offset-Y="100" fill-color="darkcyan" border-width="2" border-color="black" border-dash-array="5 5"></e-node>
      </e-nodes>
    </ej-diagram>
Gradient
There are two types of gradients.
- Linear gradient - Defines a smooth transition between a set of colors (so-called “stops”) on a line.
- Radial gradient - Defines a smooth transition between stops on a circle.
The Gradient property of Node allows you to define and applies the gradient effect to that node.
<ej-diagram id="diagram" width="900px" height="600px">
        <e-nodes>
          <e-node name="node1" width="100" height="100" offset-X="100" offset-Y="100" fill-color="darkCyan" border-width="2">
            <e-radial-gradient cx="50" cy="50" fx="50" fy="50">
                 <e-stops>
                    <e-stop color="white" offset="0"></e-stop>
                    <e-stop color="darkCyan" offset="100"></e-stop>
                </e-stops>
            </e-radial-gradient>
        </e-node>
    </e-nodes>
    </ej-diagram>

    <ej-diagram id="diagram" width="900px" height="600px">
        <e-nodes>
          <e-node name="node1" width="100" height="100" offset-X="100" offset-Y="100" fill-color="darkCyan" border-width="2">
            <e-linear-gradient x1="0" y1="0" x2="50" y2="50">
                 <e-stops>
                    <e-stop color="white" offset="0"></e-stop>
                    <e-stop color="darkCyan" offset="100"></e-stop>
                </e-stops>
            </e-linear-gradient>
        </e-node>
    </e-nodes>
    </ej-diagram>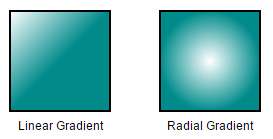
Shadow
Diagram provides support to add shadow effect to a node that is disabled by default. It can be enabled with the Constraints property of node. The following code illustrates how to drop shadow.
<ej-diagram id="diagram" width="900px" height="600px">
        <e-nodes>
          <e-node name="node1" width="100" height="100" offset-X="100" offset-Y="100" constraints ="Default|NodeConstraints.Shadow"></e-node>
        </e-nodes>
    </ej-diagram>
The following code illustrates how to disable shadow effect at runtime.
var diagram = $("#diagram").ejDiagram("instance");
    var node = diagram.findNode("node");
    var nodeConstraints = ej.datavisualization.Diagram.NodeConstraints;

    //Disables Shadow effect for a node.
    constraints = node.constraints & ~nodeConstraints.Shadow;
    diagram.updateNode("node", { constraints: constraints });
Customizing Shadow
The angle, translation, and opacity of the Shadow can be customized with the Shadow property of node. The following code example illustrates how to customize shadow.
<ej-diagram id="diagram" width="900px" height="600px">
        <e-nodes>
          <e-node name="node1" width="100" height="100" offset-X="100" offset-Y="100" constraints ="Default|NodeConstraints.Shadow">
              <e-shadow opacity="0.8f" angle="50" distance="9"></e-shadow>
          </e-node>
        </e-nodes>
    </ej-diagram>
Interaction
Diagram provides support to drag, resize, or rotate the node interactively. For more information about editing a node at runtime, refer to Edit Nodes.
Constraints
The constraints property of node allows you to enable/disable certain features. For more information about node constraints, refer to Node Constraints.