Data Binding
23 Sep 202022 minutes to read
- Diagram can be populated with the nodes and connectors based on the information provided from an external data source.
- Diagram exposes its specific data-related properties allowing you to specify the data source fields from where the node information has to be retrieved from.
To explore those properties, see Data source settings
- Diagram supports three different kinds of Data binding.
- Local Data
- Remote Data
- HTML Table Data
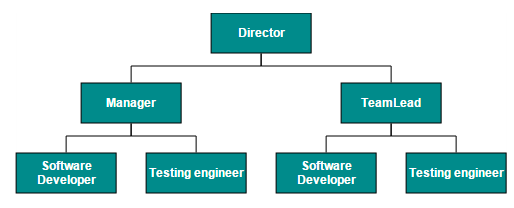
Local Data
Diagram can be populated based on the user defined JSON data (Local Data) by mapping the relevant data source fields.
To map the user defined JSON data with Diagram, you have to configure the fields of DataSourceSettings. The following code example defines the JSON data in (data.json) file and reads the data from that file to bind it to the DataSourceSetting’s DataSource property. You can also create BusinessObjects as an array and bind it to the DataSource property.
@Html.EJ().Diagram("Diagram", ViewData["diagramModel"] as Syncfusion.JavaScript.DataVisualization.Models.DiagramProperties)

    <script type="text/javascript">
        //Binds custom JSON with node
        function nodeTemplate(diagram, node) {
            // Sets the Name field of JSON data as label.
            node.labels[0].text = node.Name;
        }
    </script>
//Uses layout to auto-arrange nodes on the Diagram page
<e-layout type="HierarchicalTree" horizontal-spacing="25" vertical-spacing="35" margin-x="3" margin-y="3"></e-layout>
//Sets the default properties for nodes and connectors
<e-layout type="HierarchicalTree" horizontal-spacing="25" vertical-spacing="35" margin-x="3" margin-y="3"></e-layout>
<e-node constraints="Select | NodeConstraints.PointerEvents" width="100" height="40" border-color="black" border-width="1">
<e-labels>
<e-diagram-label name="label1" font-color="white" font-size="12">
<e-margin left="10" right="10"></e-margin>
</e-diagram-label>
</e-labels>
</e-node>
<e-connector line-color="#000000" constraints="None">
<e-segments>
<e-segment type="Orthogonal"></e-segment>
<e-target-decorator shape="None"></e-target-decorator>
</e-segments>
</e-connector>
//Configures data source for Diagram
<e-datasource-settings id="Name" parent="ReportingPerson" dataSource="ViewBag.datasource"></e-datasource-settings>
//Initializes the node template.
<ej-diagram id="diagram" width="700px" height="400px" enable-context-menu="false" tool="SingleSelect" node-template="nodeTemplate" selectionChange="selectionChanged">
public Array GetDataSource()
{
//To read reads the data from the file and to bind into the Diagram...
String allText = System.IO.File.ReadAllText(Server.MapPath("~/App_Data/data.json"));
Dictionary<string, object> requestArgs = (Dictionary<string, object>)new JavaScriptSerializer().DeserializeObject(allText);
requestArgs = (Dictionary<string, object>)requestArgs["root"];
return (Array)requestArgs.Values.ElementAt(0);
}{root: {data: [
{ "Name": "Director" },
{ "Name": "Manager", "ReportingPerson": "Director" },
{ "Name": "TeamLead", "ReportingPerson": "Director" },
{ "Name": "Software Developer", "ReportingPerson": "TeamLead" },
{ "Name": "Testing engineer", "ReportingPerson": "TeamLead" },
{ "Name": "Software Developer", "ReportingPerson": "Manager" },
{ "Name": "Testing engineer", "ReportingPerson": "Manager" }
]}}
Remote Data
You can bind the Diagram with Remote Data by using dataManager.
- DataManager supports the following types of data-binding: JSON, Web Services, oData.
- It uses two different classes: ej.DataManager for processing and ej.Query for serving data. ej.DataManager communicates with data source and ej.Query generates data queries that are read by the dataManager.
- To learn more, refer to Data Manager.
To bind remote data to the Diagram, you have to configure the fields of DataSourceSettings. The following code illustrates how to bind remote data to the Diagram.
@Html.EJ().Diagram("Diagram", ViewData["diagramModel"] as Syncfusion.JavaScript.DataVisualization.Models.DiagramProperties)

    <script type="text/javascript">
        //Binds custom JSON with node
        function nodeTemplate(diagram, node) {
            // Sets the Name field of JSON data as label.
            node.labels[0].text = node.FirstName;
        }
    </script>
//Uses layout to auto-arrange nodes on the Diagram page
<e-layout type="HierarchicalTree" horizontal-spacing="25" vertical-spacing="35" margin-x="3" margin-y="3"></e-layout>

    //Sets the default properties for nodes and connectors
    <e-layout type="HierarchicalTree" horizontal-spacing="25" vertical-spacing="35" margin-x="3" margin-y="3"></e-layout>
    <e-node constraints="Select | NodeConstraints.PointerEvents" width="100" height="40" border-color="black" border-width="1">
                <e-labels>
                    <e-diagram-label name="label1" font-color="white" font-size="12">
                        <e-margin left="10" right="10"></e-margin>
                    </e-diagram-label>
                </e-labels>
            </e-node>
            <e-connector line-color="#000000" constraints="None">
                <e-segments>
                    <e-segment type="Orthogonal"></e-segment>
                    <e-target-decorator shape="None"></e-target-decorator>
                </e-segments>
            </e-connector>

    //Configures data source for Diagram
    <e-datasource-settings id="Name" parent="ReportingPerson" dataSource="http://mvc.syncfusion.com/Services/Northwnd.svc/"></e-datasource-settings>

    //Initializes the node template.
    <ej-diagram id="diagram" width="700px" height="400px" enable-context-menu="false" tool="SingleSelect" node-template="nodeTemplate" selectionChange="selectionChanged">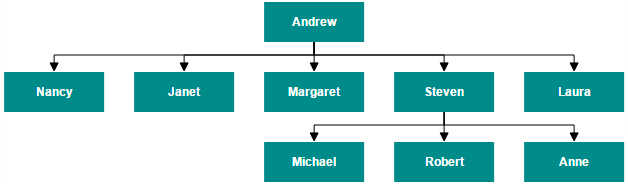
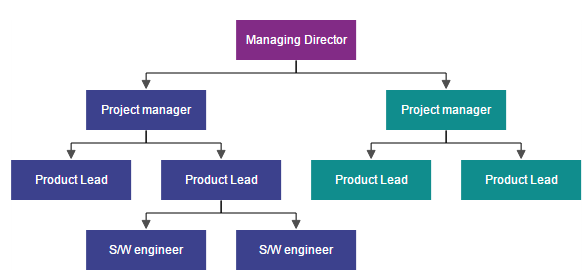
HTML Table Data
The Diagram provides support to populate the Diagram from the HTML table. It is flexible to convert HTML table to Diagram by using Data Manager.
The following code illustrates how to convert HTML table to the Diagram.
<e-layout type="HierarchicalTree" horizontal-spacing="25" vertical-spacing="35" margin-x="3" margin-y="3"></e-layout>
//Sets the default properties for nodes and connectors
<e-layout type="HierarchicalTree" horizontal-spacing="25" vertical-spacing="35" margin-x="3" margin-y="3"></e-layout>
<e-node constraints="Select | NodeConstraints.PointerEvents" width="100" height="40" border-color="black" border-width="1">
<e-labels>
<e-diagram-label name="label1" font-color="white" font-size="12">
<e-margin left="10" right="10"></e-margin>
</e-diagram-label>
</e-labels>
</e-node>
<e-connector line-color="#000000" constraints="None">
<e-segments>
<e-segment type="Orthogonal"></e-segment>
<e-target-decorator shape="None"></e-target-decorator>
</e-segments>
</e-connector>
//Configures data source for Diagram
<e-datasource-settings id="Name" parent="ReportingPerson" dataSource="http://mvc.syncfusion.com/Services/Northwnd.svc/"></e-datasource-settings>
//Initializes the node template.
<ej-diagram id="diagram" width="700px" height="400px" enable-context-menu="false" tool="SingleSelect" node-template="nodeTemplate" selectionChange="selectionChanged">@Html.EJ().Diagram("Diagram", ViewData["diagramModel"] as Syncfusion.JavaScript.DataVisualization.Models.DiagramProperties)
@using Syncfusion.JavaScript.DataVisualization.DiagramEnums
@using Syncfusion.JavaScript.DataVisualization.Models.Diagram
@using Syncfusion.JavaScript.DataVisualization.Models.Collections
@(Html.EJ().Diagram("Diagram").Width("100%").Height("600px")
@*Configures data source for Diagram*@
.DataSourceSettings(e =>
{
e.DataSource(ds => ds.Table("#hierarchicalData"))
.Id("Id")
.Parent("ReportingPerson");
}))
<!-- HTML Table -->
<script id="hierarchicalData" type="text/template" >
<table style="display: none">
<thead>
<tr>
<th>Id</th>
<th>Designation</th>
<th>Color</th>
<th>ReportingPerson</th>
</tr>
</thead>
<tbody>
<tr>
<td>parent</td>
<td>Managing Director</td>
<td>#822b86</td>
<td>null</td>
</tr>
<tr>
<td>1</td>
<td>Project manager</td>
<td>#3c418d</td>
<td>parent</td>
</tr>
<tr>
<td>2</td>
<td>Project manager</td>
<td>#108d8d</td>
<td>parent</td>
</tr>
<tr>
<td>3</td>
<td>Product Lead</td>
<td>#3c418d</td>
<td>1</td>
</tr>
<tr>
<td>4</td>
<td>Product Lead</td>
<td>#3c418d</td>
<td>1</td>
</tr>
<tr>
<td>5</td>
<td>Product Lead</td>
<td>#108d8d</td>
<td>2</td>
</tr>
<tr>
<td>6</td>
<td>Product Lead</td>
<td>#108d8d</td>
<td>2</td>
</tr>
<tr>
<td>7</td>
<td>S/W engineer</td>
<td>#3c418d</td>
<td>4</td>
</tr>
<tr>
<td>8</td>
<td>S/W engineer</td>
<td>#3c418d</td>
<td>4</td>
</tr>
</tbody>
</table>
</script>
<script type="text/javascript">
//Binds custom JSON with node
function nodeTemplate(diagram, node) {
node.labels[0].text = node.Designation;
node.fillColor = node.Color;
}
</script>