How can I help you?
Qualitative Range in ASP.NET Core BulletGraph
Qualitative Range represents the quality of a specific range in quantitative scale like good, bad and satisfactory. Color for each qualitative range is customized usingrange-stroke property. The range-end property specifies the ending point of the qualitative range. Minimum value of quantitative scale is considered as the starting point of first qualitative range and previous end points are considered as starting point for other qualitative ranges.
<ej-bullet-graph id="Bullets" height="120"  qualitative-range-size="80">
<e-quantitative-scale-settings interval="10" maximum="100" minimum="0">
<e-feature-measures>
<e-feature-measure comparative-measure="75" value="55" category="Year1">
</e-feature-measure>
<e-feature-measure comparative-measure="70" value="65" category="Year2">
</e-feature-measure>
<e-feature-measure comparative-measure="65" value="80" category="Year3">
</e-feature-measure>
</e-feature-measures>
<e-location x="50" y="20"></e-location>
</e-quantitative-scale-settings>
<e-qualitative-ranges>
<e-qualitative-range range-end="35" range-stroke="DarkRed" range-opacity="0.5">
</e-qualitative-range>
<e-qualitative-range range-end="50" range-stroke="Red" range-opacity="1">
</e-qualitative-range>
<e-qualitative-range range-end="75" range-stroke="Blue" range-opacity="0.7">
</e-qualitative-range>
<e-qualitative-range range-end="90" range-stroke="LightGreen" range-opacity="1">
</e-qualitative-range>
<e-qualitative-range range-end="100" range-stroke="Green" range-opacity="1">
</e-qualitative-range>
</e-qualitative-ranges>
</ej-bullet-graph>
The following screenshot displays Bullet Graph with different qualitative ranges in different colors. In this image, range 0 to 35 represents bad performance, 35 to 50 represents average performance, 50 to 75 represents that the performance is above average, 75 to 90 represents good performance and above 90 represents excellent performance.
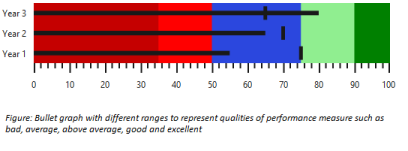
Bullet Graph with customized qualitative ranges