Getting Started
4 Jan 201822 minutes to read
This section explains briefly about how to create a TreeMap in your application with AngularJS.
Create your first TreeMap in AngularJS
You can configure an Essential JavaScript TreeMap in simple steps. In this section, you can learn how to configure a TreeMap control in a real-time scenario where it is used to visually represent the percentage of growth in population in each continent. It also provides a walk-through on some of the customization features available in TreeMap control.
Add Libraries
To add a TreeMap control in your application, refer the following libraries in an HTML page.
- jQuery version 1.10.1 and above
- ej.widget.angular.min.js
- JsRender
- ej.web.all
The following code sample explains how to link these libraries from a Content Delivery Network (CDN).
<!--  jquery script  -->
      <script src="http://code.jquery.com/jquery-1.10.1.min.js" type="text/javascript"></script>
    <!-- Essential JS UI widget -->
      <script src="http://cdn.syncfusion.com/24.2.3/js/ej.widget.angular.min.js"></script>
    <!-- JS Render widget -->
      <script src="http://cdn.jsdelivr.net/jsrender/1.0pre35/jsrender.min.js" type="text/javascript"></script>
    <!-- Essential JS theme  -->
      <script src="http://cdn.syncfusion.com/24.2.3/js/web/flat-azure/ej.web.all.min.css" type="text/javascript"></script>
Initialize TreeMap
1. Create a <div> tag with a specific id and set the height and width to determine the TreeMap size to be rendered.
2. Set the ej-treemap attribute for the div to render the treemap control.
<body>
      <div id="treemapContainer" style="width: 700px; height: 430px;" ej-treemap></div>
    </body>
Populate DataSource
The dataSource property accepts the collection values as input. For example, you can provide the list of objects as input.
Weight Value Path
You can calculate the size of the object using weightValuePath of TreeMap.
Add a <script> tag anywhere in a web page and initialize TreeMap as illustrated in the following code sample.
<div id="treemapContainer" style="width: 800px; height: 400px;" ej-treemap e-datasource="populationData" e-weightvaluepath="WValuePath">

    </div>
        <script>
            //..
            angular.module('TreemapApp', ['ejangular'])
            .controller('TreemapCtrl', function ($scope) {
                    $scope.populationData = population_data;
                    $scope.WValuePath = "Population";
                });
        </script>
Populate the TreeMap data in JSON object. For example, you can use population data of countries to generate TreeMap data as illustrated in the following code sample.
<head>
      <!-- TreeMapData -->
      <script type="text/javascript">

        var population_data = [
             { Continent: "Asia", Region: "Southern Asia", Growth: 1.32, Population: 1749046000 },
             { Continent: "Asia", Region: "Eastern Asia", Growth: 0.57, Population: 1620807000 },
             { Continent: "Asia", Region: "South-Eastern Asia", Growth: 1.20, Population: 618793000 },
             { Continent: "Asia", Region: "Western Asia", Growth: 1.98, Population: 245707000 },
             { Continent: "Asia", Region: "Central Asia", Growth: 1.43, Population: 64370000 },
             { Continent: "Europe", Region: "Europe", Growth: 0.10, Population: 742452000 },
             { Continent: "America", Region: "South America", Growth: 1.06, Population: 406740000 },
             { Continent: "America", Region: "Northern America", Growth: 0.85, Population: 355361000 },
             { Continent: "America", Region: "Central America", Growth: 1.40, Population: 167387000 },
             { Continent: "Africa", Region: "Eastern Africa", Growth: 2.89, Population: 373202000 },
             { Continent: "Africa", Region: "Western Africa", Growth: 2.78, Population: 331255000 },
             { Continent: "Africa", Region: "Northern Africa", Growth: 1.70, Population: 210002000 },
             { Continent: "Africa", Region: "Middle Africa", Growth: 2.79, Population: 135750000 },
             { Continent: "Africa", Region: "Southern Africa", Growth: 0.91, Population: 60425000 }]
      </script>
    </head>
NOTE
Population data is referred from List of continents by population.
The final HTML file is illustrated in the following code sample.
<html xmlns="http://www.w3.org/1999/xhtml">
      <head>
        <title></title>

        <!--  jquery script  -->
        <script src="http://code.jquery.com/jquery-1.10.1.min.js" type="text/javascript"></script>

        <!-- Essential JS UI widget -->
        <script src="http://cdn.syncfusion.com/24.2.3/js/ej.widget.angular.min.js"></script>

        <!-- JS Render widget -->
        <script src="http://cdn.jsdelivr.net/jsrender/1.0pre35/jsrender.min.js" type="text/javascript"></script>

        <!-- Essential JS theme -->
        <script src="http://cdn.syncfusion.com/24.2.3/js/web/flat-azure/ej.web.all.min.css" type="text/javascript"></script>

        <!-- TreeMapData -->
        <script type="text/javascript">

            var population_data = [
             { Continent: "Asia", Region: "Southern Asia", Growth: 1.32, Population: 1749046000 },
             { Continent: "Asia", Region: "Eastern Asia", Growth: 0.57, Population: 1620807000 },
             { Continent: "Asia", Region: "South-Eastern Asia", Growth: 1.20, Population: 618793000 },
             { Continent: "Asia", Region: "Western Asia", Growth: 1.98, Population: 245707000 },
             { Continent: "Asia", Region: "Central Asia", Growth: 1.43, Population: 64370000 },
             { Continent: "Europe", Region: "Europe", Growth: 0.10, Population: 742452000 },
             { Continent: "America", Region: "South America", Growth: 1.06, Population: 406740000 },
             { Continent: "America", Region: "Northern America", Growth: 0.85, Population: 355361000 },
             { Continent: "America", Region: "Central America", Growth: 1.40, Population: 167387000 },
             { Continent: "Africa", Region: "Eastern Africa", Growth: 2.89, Population: 373202000 },
             { Continent: "Africa", Region: "Western Africa", Growth: 2.78, Population: 331255000 },
             { Continent: "Africa", Region: "Northern Africa", Growth: 1.70, Population: 210002000 },
             { Continent: "Africa", Region: "Middle Africa", Growth: 2.79, Population: 135750000 },
             { Continent: "Africa", Region: "Southern Africa", Growth: 0.91, Population: 60425000 }]

        </script>
      </head>
    <body>

      <div id="treemapContainer" style="align-content:center;width: 800px; height: 400px;" ej-treemap
      e-datasource="populationData" e-weightvaluepath="WValuePath">

    </div>
        <script>
            angular.module('TreemapApp', ['ejangular'])
            .controller('TreemapCtrl', function ($scope) {
                    $scope.populationData = population_data;
                    $scope.WValuePath = "Population";
                });
        </script>
    </body>
    </html>
The following screenshot displays a TreeMap control that is rendered after executing the above code sample. The control is rendered with the default properties using the above code.

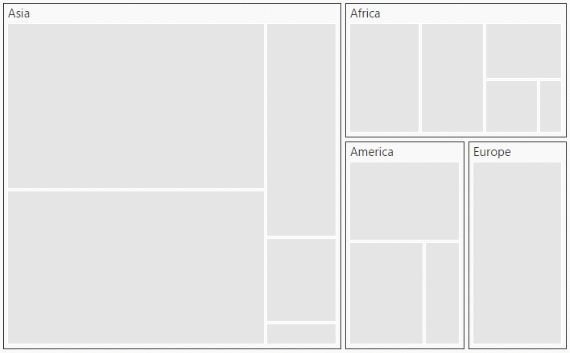
Group with Levels
You can group TreeMap items using the levels in it.
Group Path
You can use groupPath property for every flat level of the TreeMap control. It is a path to a field on the source object that serves as the “Group” for the level specified. You can group the data based on the groupPath in the TreeMap control. When the groupPath is not specified, then the items are not grouped and the data is displayed in the order specified in the dataSource.
Group Gap
You can use groupGap property to separate the items from every flat level and to differentiate the levels mentioned in the TreeMap control.
The following code sample explains how to group TreeMap Items using ‘Levels’.
<body ng-controller="TreemapCtrl">
    <div id="treemapContainer" style="align-content:center;width: 800px; height: 400px;" ej-treemap>
        <div e-levels>
            <e-level e-grouppath="name" e-groupgap="gap"></e-level>
        </div>
    </div>
        <script>
            angular.module('TreemapApp', ['ejangular'])
           .controller('TreemapCtrl', function ($scope) {
                    //..
                    $scope.name = "Continent";
                    $scope.gap = 5;
                });
        </script>


</body>
The following screenshot displays grouping of TreeMapItems using Levels.
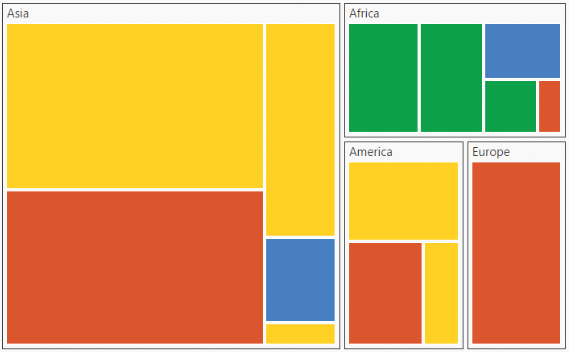
Customize TreeMap by Range
You can differentiate the nodes based on its value and color ranges using Range color. You can also define the color value range using from and to properties.
Color Value Path
The colorValuePath of TreeMap is a path to a field on the source object. You can determine the color for the object using colorValuePath of TreeMap.
The following code sample explains how to customize TreeMap appearance using Range.
<div id="treemapContainer" style="align-content:center;width: 800px; height: 400px;" ej-treemap >
       //...
        <div e-rangecolormapping>
            <e-rangecolor e-from="nfrom1" e-to="nto1" e-color="ncolor1">
            </e-rangecolor>
            <e-rangecolor e-from="nfrom2" e-to="nto2" e-color="ncolor2">
            </e-rangecolor>
            <e-rangecolor e-from="nfrom3" e-to="nto3" e-color="ncolor3">
            </e-rangecolor>
            <e-rangecolor e-from="nfrom4" e-to="nto4" e-color="ncolor4">
            </e-rangecolor>
        </div>
    </div>
        <script>

            angular.module('TreemapApp', ['ejangular'])
                .controller('TreemapCtrl', function ($scope) {
                    //...
                    $scope.nfrom1 = "0";
                    $scope.nto1 = "1";
                    $scope.ncolor1 = "#DC562D";
                    $scope.nfrom2 = "1";
                    $scope.nto2 = "1.5";
                    $scope.ncolor2 = "#FED124";
                    $scope.nfrom3 = "1.5";
                    $scope.nto3 = "2";
                    $scope.ncolor3 = "#487FC1";
                    $scope.nfrom4 = "2";
                    $scope.nto4 = "3";
                    $scope.ncolor4 = "#0E9F49";
                });
        </script>
The following screenshot displays a customized TreeMap control.
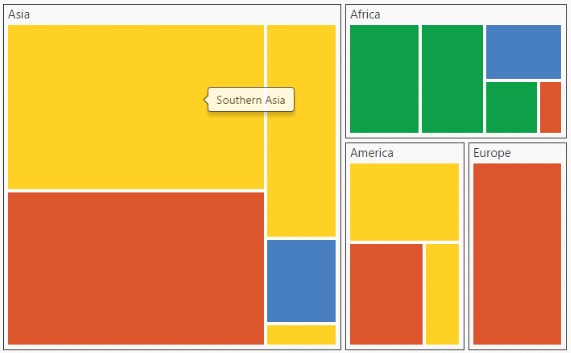
Enable Tooltip
You can enable the tooltip by setting showTooltip property to “true”. By default, it takes the property of the bound object that is referred in the weightValuePath and displays its content when the corresponding node is hovered. You can customize the template for tooltip using tooltipTemplate property.
Leaf ItemSettings
You can customize the Leaf level TreeMap items using leafItemSettings. The Label and tooltip values take the property of bound object that is referred in the labelPath when defined. The following code sample displays how the tooltip is enabled.
<div id="treemapContainer" style="align-content:center;width: 800px; height: 400px;" ej-treemap
         e-showtooltip="true"
         e-leafitemsettings-labelPath="path">
    </div>
        <script>

            angular.module('TreemapApp', ['ejangular'])
                .controller('TreemapCtrl', function ($scope) {
                    //...
                    $scope.path = "Region";
                });
        </script>
The following screenshot displays a ToolTip in a TreeMap control.
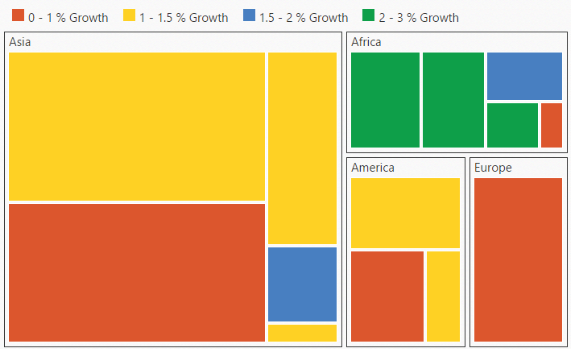
Enable Legend
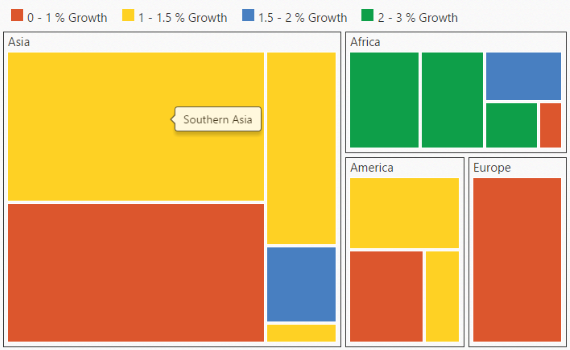
You can set the color value of leaf nodes using TreeMap Legend. This legend is appropriate only for the TreeMap whose leaf nodes are colored using rangeColorMapping. You can set showLegend property value to “true” to make a legend visible.
Label for Legend
You can customize the labels of the legend item using legendLabel property of rangeColorMapping.
The following code sample illustrates how to add labels for legend in a TreeMap.
<div id="treemapContainer" style="align-content:center;width: 800px; height: 400px;" ej-treemap
         e-showlegend="true"
         e-legendsettings="legendSettings">
        <div e-rangecolormapping>
            <e-rangecolor  e-legendlabel="legendlabel1">
            </e-rangecolor>
            <e-rangecolor  e-legendlabel="legendlabel2">
            </e-rangecolor>
            <e-rangecolor  e-legendlabel="legendlabel3">
            </e-rangecolor>
            <e-rangecolor  e-legendlabel="legendlabel4">
            </e-rangecolor>
        </div>
    </div>
        <script>

            angular.module('TreemapApp', ['ejangular'])
                .controller('TreemapCtrl', function ($scope) {
                    //...

                    $scope.legendlabel1 = "0 - 1 %    Growth";
                    $scope.legendlabel2 = "1 - 1.5 %    Growth";
                    $scope.legendlabel3 = "1.5 - 2 %    Growth";
                    $scope.legendlabel4 = "2 - 3 %    Growth";
                    $scope.legendSettings = {
                        showLegend: true,
                        height: 38,
                        width: 690,
                    };
                });
        </script>
The following screenshot displays labels in a TreeMap control.
NOTE
Population data is referred from List of continents by population.