Sunburst Elements
6 Mar 20181 minute to read
The Sunburst region represents the entire chart and all its elements. It includes all the chart elements like Legend, DataLabel, Levels etc. The major properties of the Sunburst Chart are as follows
-
datasource– Provides the data that are used to generate the chart. -
valueMemberPath- Property based on the which the data segment are rendered in the Sunburst chart -
legend– displays the legend of the Sunburst Chart -
levels- displays the hierarchical levels for the chart -
dataLabel– displays the data label for the Sunburst Chart
Start and End Angle
Start and End Angle
You can change the start and end angle of Sunburst chart using e-startangle and e-endangleproperty as shown in below code
<div id="container" ej-sunburstchart e-startangle="-90" e-endangle="90">
</div>
Sunburst Radius
The Radius of the Sunburst chart can be customized by using the e-radius property. The default value of radius is 1 and its value ranges between 0 and 1
<div id="container" ej-sunburstchart e-radius="0.8">
</div>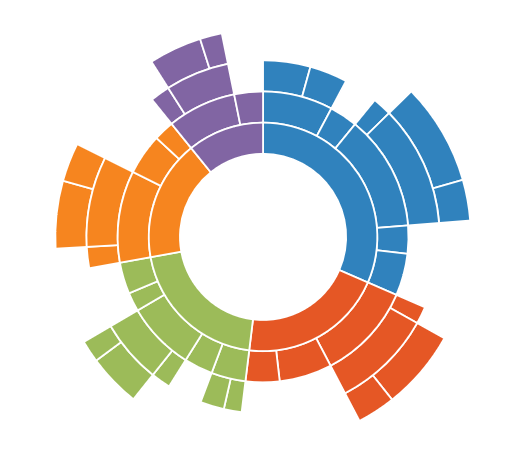 ;
;
## Sunburst Inner Radius
The Inner Radius of the Sunburst chart can be customized by using the e-innerradius property. The default value of innerRadius is 0.4 and its value ranges between 0 and 1
<div id="container" ej-sunburstchart e-innerradius="0.5">
</div>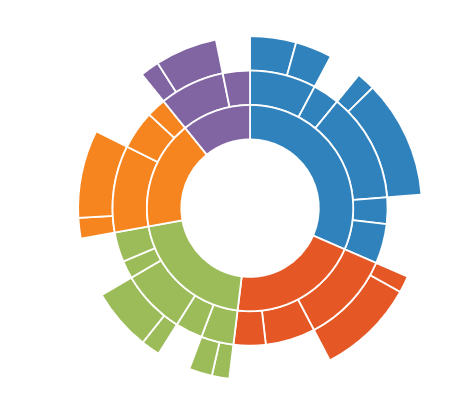 ;
;