Ticks
28 Jun 20172 minutes to read
Adding Tick Collection
Tick collection can be directly added to the scales option within the PivotGauge widget as an array.
<div ng-controller="PivotGaugeCtrl">
    <div id="PivotGauge1" ej-pivotgauge e-scales="scales" />
</div>
<script>
    var scale= [{
        //..
        ticks: [{
            type: "major"
        }]
    }];
    angular.module('PivotGaugeApp', ['ejangular']).controller('PivotGaugeCtrl', function ($scope) {
        //..
        $scope.scales = scale;
    });
</script>
Tick Customization
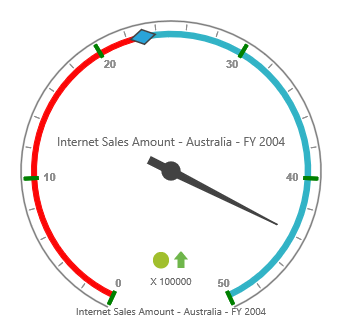
The appearance of the tick can be customized through the following properties.
- type – indicates whether ticks are for major or minor intervals. By default, the type is “major”.
- height – sets the height of the ticks.
- width – sets the width of the ticks.
- angle – rotates the ticks to a specified angle. By default, the angle value is 0.
- color – displays the ticks in specified color.
- distanceFromScale – sets the distance between scale and ticks. By default, the values is 0.
- placement – positions the ticks with respect to the scale. By default, the value is set to “far”.
<script>
    var scale= [{
        //..
        ticks: [{
            type: "major",
            height: 15,
            width: 4,
            angle: 0,
            color: "green",
            distanceFromScale: 2,
            placement: "near"
        }]
    }];
    angular.module('PivotGaugeApp', ['ejangular']).controller('PivotGaugeCtrl', function ($scope) {
        //..
        $scope.scales = scale;
    });
</script>