Scale
28 Jun 20174 minutes to read
Adding Scale
Scale can be added within the PivotGauge widget as an array.
<div ng-controller="PivotGaugeCtrl">
    <div id="PivotGauge1" ej-pivotgauge e-scales="scales" />
</div>
<script>
    var scale= [{
        //..
        showScaleBar: true,
        radius: 150
        //..
    }];
    angular.module('PivotGaugeApp', ['ejangular']).controller('PivotGaugeCtrl', function ($scope) {
        //..
        $scope.scales = scale;
    });
</script>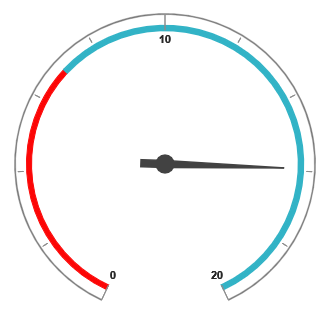
Scale Customization
Pointer Cap
Pointer Cap is a circular shape element which is located at the center of the PivotGauge. It can be customized with the property pointerCap inside the scales option. Following are the properties used to customize its appearance.
- radius – sets the radius of the pointer cap.
- borderColor – sets the color of the pointer cap border.
- borderWidth – sets the width of the pointer cap border.
- backgroundColor – sets the background color of the pointer cap.
<div ng-controller="PivotGaugeCtrl">
    <div id="PivotGauge1" ej-pivotgauge e-scales="scales" />
</div>
<script>
    var scale= [{
        //..
        showScaleBar: true,
        pointerCap: {
            radius: 5,
            borderWidth: 2,
            borderColor: "green",
            backgroundColor: "yellow"
        }
        //..
    }];
    angular.module('PivotGaugeApp', ['ejangular']).controller('PivotGaugeCtrl', function ($scope) {
        //..
        $scope.scales = scale;
    });
</script>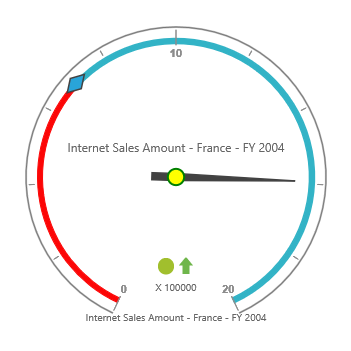
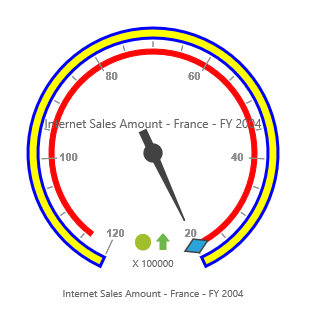
Appearance
The appearance of the scale can be customized through the following properties.
- radius – sets the radius of the scale.
- backgroundColor – sets the background color of the scale.
- border – sets the border of the scale with color and width properties.
- size – sets the size of the scale.
- minimum – sets the least value of the scale.
- maximum – sets the highest value of the scale.
- majorIntervalValue – sets the interval between major ticks in the scale.
- minorIntervalValue – sets the interval between minor ticks in the scale.
- direction – sets the direction of the scale. By default it takes “Clockwise” direction.
The showIndicators, showTicks, showRanges, showPointers and showScaleBar properties are used to enable/disable the indicators, ticks, ranges, pointers and scale bar respectively. By default, showTicks and showPointers are set to true, other properties are set as false.
<div ng-controller="PivotGaugeCtrl">
    <div id="PivotGauge1" ej-pivotgauge e-scales="scales" />
</div>
<script>
    var scale= [{
        //..
        showScaleBar: true,
        radius: 120,
        backgroundColor: "yellow",
        border: {
            color: "Blue",
            width: 3
        },
        size: 10,
        minimum: 20,
        maximum: 120,
        majorIntervalValue: 20,
        minorIntervalValue: 5,
        direction: ej.datavisualization.CircularGauge.Directions.CounterClockwise
        //..
    }];
    angular.module('PivotGaugeApp', ['ejangular']).controller('PivotGaugeCtrl', function ($scope) {
        //..
        $scope.scales = scale;
    });
</script>