Series
28 Jun 20171 minute to read
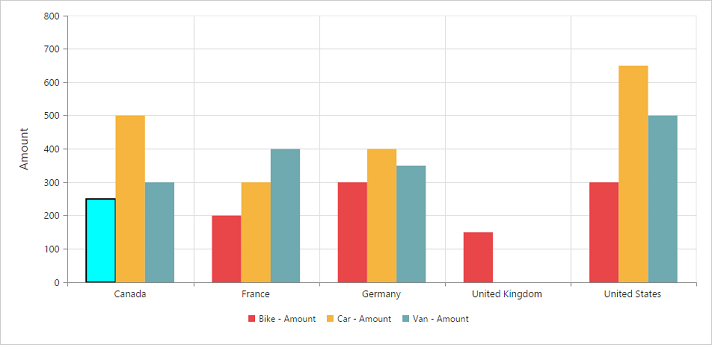
Series Point Customization
By using the fill and border properties of Chart series, you can customize the PivotChart series color, border color and border width.
<body>
    <div ng-controller="PivotChartCtrl">
        <div id="PivotChart1" ej-pivotchart e-commonSeriesOptions="commonSeriesOptions" e-seriesRendering="seriesRendering"/>
    </div>
    <script>
        angular.module('PivotChartApp', ['ejangular']).controller('PivotChartCtrl', function ($scope) {
            ///..
            $scope.commonSeriesOptions = {
                type: ej.PivotChart.ChartTypes.Column
            };
            $scope.seriesRendering = function(args){
                this.model.series[0].points[0].fill = "aqua";
                this.model.series[0].points[0].border = {
                    color: "black",
                    width: 2
                };
            };
        });
    </script>
</body>