Appearance
28 Jun 20177 minutes to read
Built-in Themes
Following are the built-in themes available in the PivotChart.
- flatlight
- gradientlight
- gradientdark
- azure
- azuredark
- lime
- limedark
- saffron
- saffrondark
- gradientlight
- gradientdark
- highcontrast01
- highcontrast02
- material
- office365
- bootstrap
By using the e-theme property, you can set the desired theme in PivotChart. By default, “Flat Light” theme is applied to PivotChart.
<div ng-controller="PivotChartCtrl">
    <div id="PivotChart1" ej-pivotchart e-theme="gradientlight"/>
</div>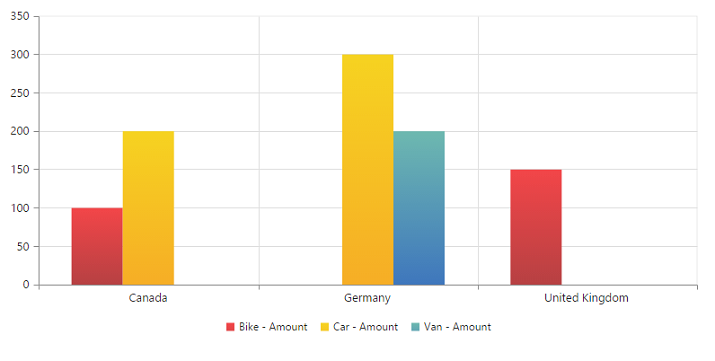
PivotChart - Area Customization
Border Customization
To customize the PivotChart border, use e-border property in PivotChart.
<body>
    <div ng-controller="PivotChartCtrl">
        <div id="PivotChart1" ej-pivotchart e-border="border"/>
    </div>
    <script>
        angular.module('PivotChartApp', ['ejangular']).controller('PivotChartCtrl', function ($scope) {
            ///..
            //Customize the Chart border and opacity
            $scope.border = {
                color: "#FF0000",
                width: 5,
                opacity: 0.35
            };
        });
    </script>
</body>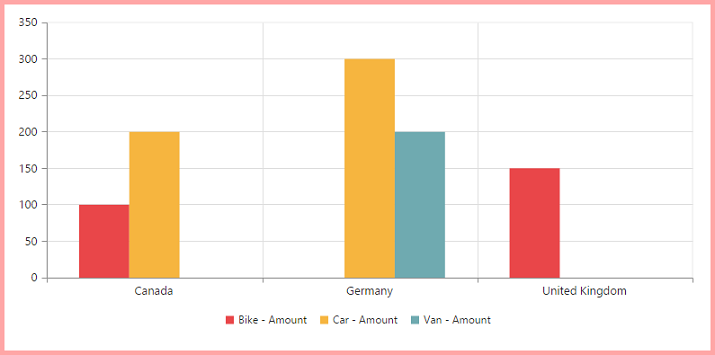
Margin Customization
The PivotChart control e-margin property is used to add the margin to the Chart area at left, right, top and bottom position.
<body>
    <div ng-controller="PivotChartCtrl">
        <div id="PivotChart1" ej-pivotchart e-margin="margin"/>
    </div>
    <script>
        angular.module('PivotChartApp', ['ejangular']).controller('PivotChartCtrl', function ($scope) {
            ///..
            $scope.margin = {
                left: 40,
                right: 40,
                top: 40,
                bottom: 40
            };
        });
    </script>
</body>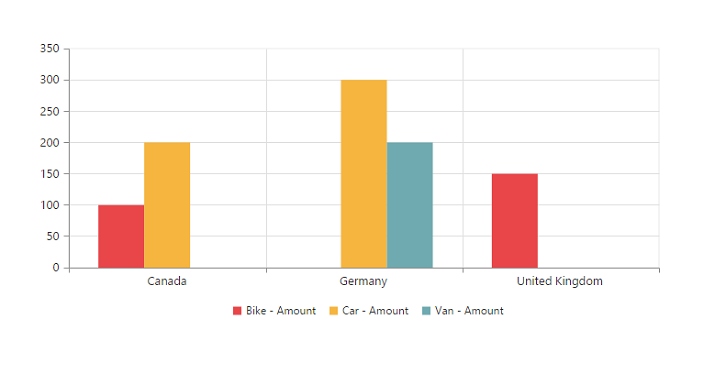
Background Customization
The PivotChart control background can be customized by using the background property in the Chart area.
<body>
    <div ng-controller="PivotChartCtrl">
        <div id="PivotChart1" ej-pivotchart e-chartArea="chartArea"/>
    </div>
    <script>
        angular.module('PivotChartApp', ['ejangular']).controller('PivotChartCtrl', function ($scope) {
            ///..
            $scope.chartArea = {
                //Setting background for Chart area
                background: "skyblue"
            };
        });
    </script>
</body>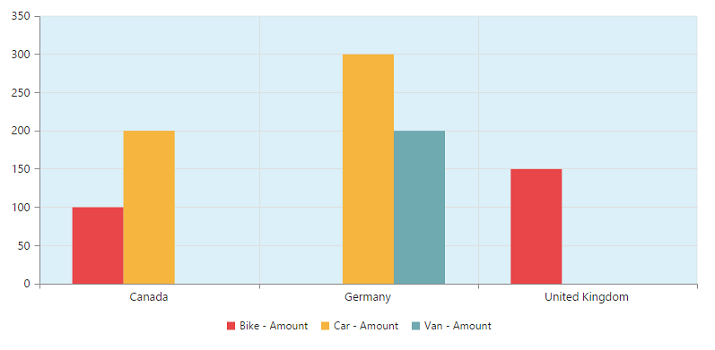
Grid Bands Customization
By using the alternateGridBand property of the axis, you can provide different color for grid rows and columns formed by the grid lines in the Chart area. The properties odd and even are used to customize the grid bands at odd and even positions respectively.
<body>
    <div ng-controller="PivotChartCtrl">
        <div id="PivotChart1" ej-pivotchart e-primaryYAxis="primaryYAxis"/>
    </div>
    <script>
        angular.module('PivotChartApp', ['ejangular']).controller('PivotChartCtrl', function ($scope) {
            ///..
            $scope.primaryYAxis = {
                //....
                //Customizing horizontal grid bands at even position
                alternateGridBand:
                {
                    even:
                    {
                        fill: "#A7A9AB",
                        opacity: 0.1,
                    }
                },
                //....
            };
        });
    </script>
</body>
Animation
You can enable animation by using the enableAnimation property under commonSeriesOptions of the PivotChart control. This animates the Chart series on two occasions - when the Chart is loaded for the first time and when you change the series type by using the “type” property.
<body>
    <div ng-controller="PivotChartCtrl">
        <div id="PivotChart1" ej-pivotchart e-commonSeriesOptions="commonSeriesOptions"/>
    </div>
    <script>
        angular.module('PivotChartApp', ['ejangular']).controller('PivotChartCtrl', function ($scope) {
            ///..
            $scope.commonSeriesOptions = {
                //Enabling animation in series
                enableAnimation: true,
                //....
            };
        });
    </script>
</body>