3D Visualization
28 Jun 20176 minutes to read
The PivotChart control allows you to view the data in a 3D view. Following are the chart types that are supported:
- Bar
- Column
- Stacking Bar
- Stocking Column
- Pie
3D Column Chart
3D Column Chart is rendered by specifying the chart type as “Column” in the “type” enumeration property of “commonSeriesOptions” along with e-enable3D property set to “true”.
<body>
    <div ng-controller="PivotChartCtrl">
        <div id="PivotChart1" ej-pivotchart e-commonseriesoptions-type="ctyp" e-enable3D="true"/>
    </div>
    <script>
        angular.module('PivotChartApp', ['ejangular']).controller('PivotChartCtrl', function ($scope) {
            ///..
            $scope.ctype = {
                //Setting chart type to column
                type: ej.PivotChart.ChartTypes.Column
            }
        });
    </script>
</body>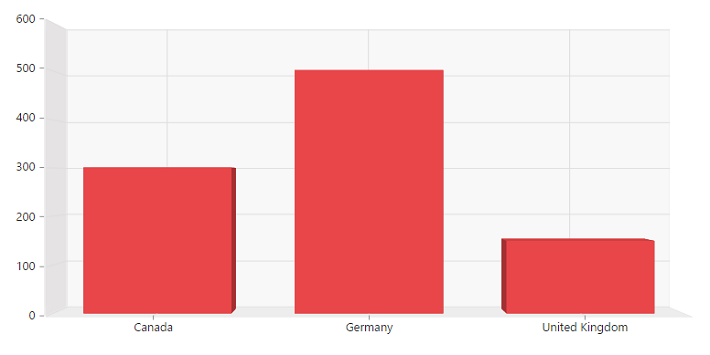
3D Bar Chart
3D Bar Chart is rendered by specifying the chart type as “Bar” in the “type” enumeration property of “commonSeriesOptions” along with e-enable3D property set to “true”.
<body>
    <div ng-controller="PivotChartCtrl">
        <div id="PivotChart1" ej-pivotchart e-commonseriesoptions-type="ctyp" e-enable3D="true"/>
    </div>
    <script>
        angular.module('PivotChartApp', ['ejangular']).controller('PivotChartCtrl', function ($scope) {
            ///..
            $scope.ctype = {
                //Setting chart type to bar
                type: ej.PivotChart.ChartTypes.Bar
            }
        });
    </script>
</body>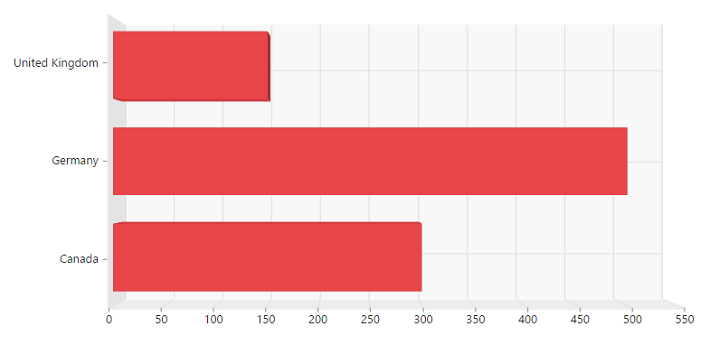
3D Stacking Bar Chart
3D Stacking Bar Chart is rendered by specifying the chart type as “Stacking Bar” in the “type” enumeration property of “commonSeriesOptions” along with e-enable3D property set to “true”.
<body>
    <div ng-controller="PivotChartCtrl">
        <div id="PivotChart1" ej-pivotchart e-commonseriesoptions-type="ctyp" e-enable3D="true"/>
    </div>
    <script>
        angular.module('PivotChartApp', ['ejangular']).controller('PivotChartCtrl', function ($scope) {
            ///..
            $scope.ctype = {
                //Setting chart type to stacking bar
                type: ej.PivotChart.ChartTypes.StackingBar
            }
        });
    </script>
</body>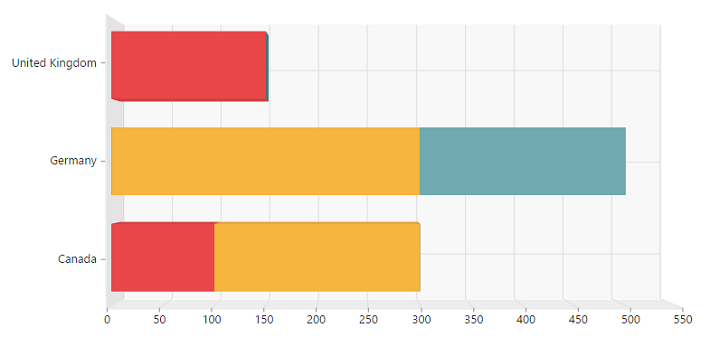
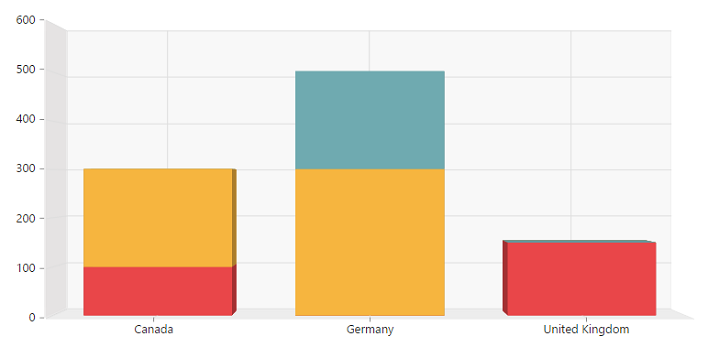
3D Stacking Column Chart
3D Stacking Column Chart is rendered by specifying the chart type as “Stacking Column” in the “type” enumeration property of “commonSeriesOptions” along with e-enable3D property set to “true”.
$("#PivotChart1").ejPivotChart(
    {
        .....
        .....
        //Enable 3D Chart
        enable3D: true,
        commonSeriesOptions:
        {
            //Setting chart type to stacking column
            type: ej.PivotChart.ChartTypes.StackingColumn
        }
    });
3D Pie Chart
3D Pie Chart is rendered by specifying the chart type as “Pie” in the “type” enumeration property of “commonSeriesOptions” along with e-enable3D property set to “true”.
<body>
    <div ng-controller="PivotChartCtrl">
        <div id="PivotChart1" ej-pivotchart e-commonseriesoptions-type="ctyp" e-enable3D="true"/>
    </div>
    <script>
        angular.module('PivotChartApp', ['ejangular']).controller('PivotChartCtrl', function ($scope) {
            ///..
            $scope.ctype = {
                //Setting chart type to pie
                type: ej.PivotChart.ChartTypes.Pie
            }
        });
    </script>
</body>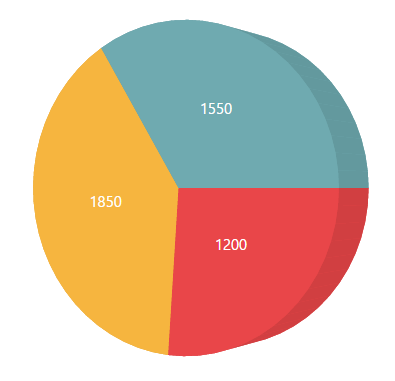
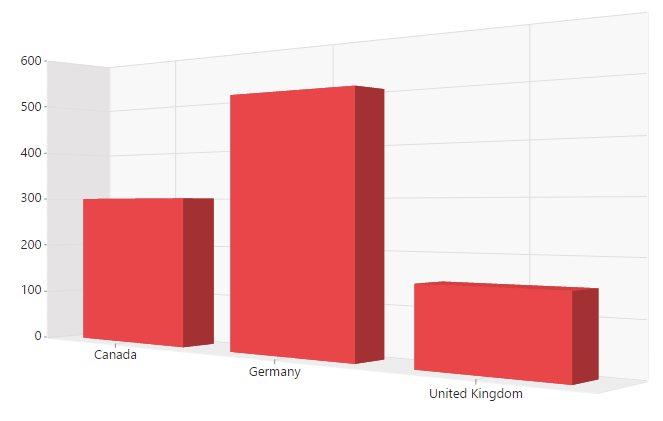
Rotating 3D Chart
We can rotate the 3D Chart towards left or right by setting an appropriate angle value to the e-rotation property. The direction of the Chart display depends upon the positive or negative angle value.
<body>
    <div ng-controller="PivotChartCtrl">
        <div id="PivotChart1" ej-pivotchart e-enable3D="true" e-rotation=40/>
    </div>
    <script>
        angular.module('PivotChartApp', ['ejangular']).controller('PivotChartCtrl', function ($scope) {
            ///..
        });
    </script>
</body>