Scales
8 Mar 201824 minutes to read
Scales are the basic functional block of the Linear Gauge. You can improve the appearance of scales by customizing it. The functional blocks of Linear Gauge are
-
Marker Pointers
-
Bar Pointer
-
Labels
-
Custom Labels
-
Indicators
-
Ticks
-
Ranges
Adding scale collection
Scale is the basic element of Linear Gauge. Scale collection is directly added to the gauge object. Refer the following code example to add scale collection in Gauge control.
<html xmlns="http://www.w3.org/1999/xhtml" lang="en" ng-app="LinearGaugeApp">
    <head>
        <title>Essential Studio for AngularJS: LinearGauge</title>
        <!--CSS and Script file References -->
    </head>
    <body ng-controller="LinearGaugeCtrl">
        <div id="linearframe">
                 <ej-lineargauge e-enableanimation="false"
                 e-frame-backgroundImageUrl="../images/gauge/Gauge_linear_light.png" >
                 <e-scales>
                 <e-scale  e-width="8" e-position-x="20" e-position-y="50" e-backgroundColor="grey"
                 e-border-color="transparent" e-border-width="1" e-showBarPointers="true"
                 e-showmarkerpointers="true" >
                 <e-labels>
                 <e-label  e-distancefromscale-x="50" e-distancefromscale-y="0"></e-label>
                 </e-labels>
                 <e-markerpointers>
                 <e-markerpointer  e-type="pentagon" e-placement="near" e-width="20" e-length="10"
                 e-backgroundColor="#FE8282" e-distancefromscale="20">
                 </e-markerpointer>
                 </e-markerpointers>
                 <e-ticks>
                 <e-tick e-type="majorinterval" e-width="2" e-color="#8c8c8c" e-distancefromscale-x="30"
                 e-distancefromscale-y="0"></e-tick>
                 <e-tick e-type="minorinterval" e-width="1" e-height="6" e-color="#8c8c8c"
                 e-distancefromscale-x="30" e-distancefromscale-y="0"></e-tick>
                 </e-ticks>
                 </e-scale>
                 </e-scales>
                 </ej-lineargauge>
        </div>
        <script>
        angular.module('LinearGaugeApp', ['ejangular'])
        .controller('LinearGaugeCtrl', function ($scope) {
         });
    </script>
    </body>
</html>
Execute the above code to render the following output.
Scale Customization
Colors and Border
-
The Scale border is modified with border object. It has two border property, color and width are used to customize the border color of the scale and border width of the scale. Setting the background color improves the look and feel of the Linear Gauge. You can customize the background color of the scale using backgroundColor.
-
Scales are used to enable or disable various properties such as showRanges, showIndicators, showCustomLabels, showLabels, showTicks, showBarPointers and showMarkerPointers. Enable/disable is done by setting the property into two states either “true” or “false”. You can adjust the Opacity of the scale with opacity property.
<html xmlns="http://www.w3.org/1999/xhtml" lang="en" ng-app="LinearGaugeApp">
    <head>
        <title>Essential Studio for AngularJS: LinearGauge</title>
        <!--CSS and Script file References -->
    </head>
    <body ng-controller="LinearGaugeCtrl">
        <div id="linearframe">
                 <ej-lineargauge e-enableanimation="false"
                 e-frame-backgroundImageUrl="../images/gauge/Gauge_linear_light.png" >
                 <e-scales>
                 <e-scale  e-width="8" e-position-x="20" e-position-y="50" e-backgroundColor="#FE8282"
                 e-opacity="0.5" e-shadowoffset="10" e-type="RoundedRectangle" e-border-color="red"
                 e-border-width="1" e-showBarPointers="false" e-showmarkerpointers="true" >
                 <e-labels>
                 <e-label  e-distancefromscale-x="50" e-distancefromscale-y="0"></e-label>
                 </e-labels>
                 <e-markerpointers>
                 <e-markerpointer  e-type="pentagon" e-placement="near" e-width="20" e-length="10"
                 e-backgroundColor="#C9E1E5" e-distancefromscale="20">
                 </e-markerpointer>
                 </e-markerpointers>
                 <e-ticks>
                 <e-tick e-type="majorinterval" e-width="2" e-color="#8c8c8c" e-distancefromscale-x="30"
                 e-distancefromscale-y="0"></e-tick>
                 <e-tick e-type="minorinterval" e-width="1" e-height="6" e-color="#8c8c8c"
                 e-distancefromscale-x="30" e-distancefromscale-y="0"></e-tick>
                 </e-ticks>
                 </e-scale>
                 </e-scales>
                 </ej-lineargauge>
        </div>
        <script>
        angular.module('LinearGaugeApp', ['ejangular'])
        .controller('LinearGaugeCtrl', function ($scope) {
         });
    </script>
    </body>
</html>
Execute the above code to render the following output.
Appearance
-
You can improve the appearance of Linear Gauge using various properties. You can set the interval values for the scale with major interval value and minor interval value properties and maximum and minimum value by minimum and maximum property. The width property is used to set the scale bar width.
-
You can also adjust the Opacity of the scale with opacity property. The value for opacity lies between 0 and 1.Linear Gauge contains two scale directions, clockwise and counter clockwise. It can be set with direction property.
<html xmlns="http://www.w3.org/1999/xhtml" lang="en" ng-app="LinearGaugeApp">
    <head>
        <title>Essential Studio for AngularJS: LinearGauge</title>
        <!--CSS and Script file References -->
    </head>
    <body ng-controller="LinearGaugeCtrl">
        <div id="linearframe">
                 <ej-lineargauge e-enableanimation="false"
                 e-frame-backgroundImageUrl="../images/gauge/Gauge_linear_light.png" >
                 <e-scales>
                 <e-scale  e-width="18"  e-minimum="10" e-maximum="210" e-minorIntervalValue="25"
                 e-majorIntervalValue="50" e-direction="counterclockwise" e-position-x="20"
                 e-position-y="50" e-backgroundColor="gray" e-border-color="gray" e-border-width="1"
                 e-showBarPointers="false" e-showmarkerpointers="true" >
                 <e-labels>
                 <e-label  e-distancefromscale-x="50" e-distancefromscale-y="0"></e-label>
                 </e-labels>
                 <e-markerpointers>
                 <e-markerpointer  e-type="pentagon" e-placement="near" e-width="20" e-length="10"
                 e-backgroundColor="#FE8282" e-distancefromscale="20">
                 </e-markerpointer>
                 </e-markerpointers>
                 <e-ticks>
                 <e-tick e-type="majorinterval" e-width="2" e-color="#8c8c8c" e-distancefromscale-x="30"
                 e-distancefromscale-y="0"></e-tick>
                 <e-tick e-type="minorinterval" e-width="1" e-height="6" e-color="#8c8c8c"
                 e-distancefromscale-x="30" e-distancefromscale-y="0"></e-tick>
                 </e-ticks>
                 </e-scale>
                 </e-scales>
                 </ej-lineargauge>
        </div>
        <script>
        angular.module('LinearGaugeApp', ['ejangular'])
       .controller('LinearGaugeCtrl', function ($scope) {
         });
    </script>
    </body>
</html>
Execute the above code to render the following output.

Scale Types
Scale Type is an element which decides the appearance of the gauge. Linear Gauge contains three scale types such as,
-
Rectangle
-
Rounded Rectangle
-
Thermometer
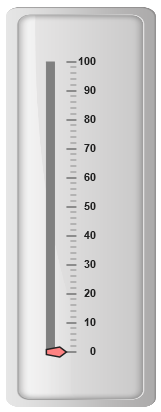
Rectangle
For rectangular scale type, the scale renders with rectangular structure. Refer the following code example.
<html xmlns="http://www.w3.org/1999/xhtml" lang="en" ng-app="LinearGaugeApp">
    <head>
        <title>Essential Studio for AngularJS: LinearGauge</title>
        <!--CSS and Script file References -->
    </head>
    <body ng-controller="LinearGaugeCtrl">
        <div id="linearframe">
                 <ej-lineargauge e-enableanimation="false"
                 e-frame-backgroundImageUrl="../images/gauge/Gauge_linear_light.png" >
                 <e-scales>
                 <e-scale  e-width="18" e-length="300" e-position-x="54" e-position-y="50"
                 e-type="rectangle" e-backgroundColor="#C0B08E" e-border-color="#C0B08E"
                 e-border-width="1" e-showBarPointers="false" e-showmarkerpointers="false">
                 <e-ticks>
                 <e-tick e-type="majorinterval" e-width="2" e-color="#206BA4" e-placement="far"
                 e-distancefromscale-x="-27" e-distancefromscale-y="0"></e-tick>
                 <e-tick e-type="minorinterval" e-width="1" e-height="6" e-color="#206BA4"
                 e-placement="far" e-distancefromscale-x="-27" e-distancefromscale-y="0">
                 </e-tick>
                 </e-ticks>
                 </e-scale>
                 </e-scales>
                 </ej-lineargauge>
        </div>
        <script>
        angular.module('LinearGaugeApp', ['ejangular'])
        .controller('LinearGaugeCtrl', function ($scope) {
         });
    </script>
    </body>
</html>
Execute the above code to render the following output.
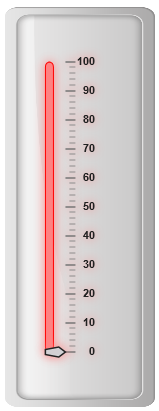
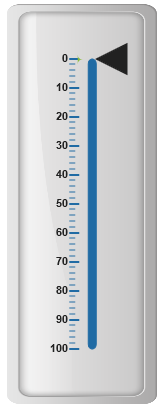
Rounded Rectangle
For rounded rectangular scale type, the scale renders as rectangular structure but with constant radius rounded corner. Refer the following code example.
<html xmlns="http://www.w3.org/1999/xhtml" lang="en" ng-app="LinearGaugeApp">
    <head>
        <title>Essential Studio for AngularJS: LinearGauge</title>
        <!--CSS and Script file References -->
    </head>
    <body ng-controller="LinearGaugeCtrl">
        <div id="linearframe">
                 <ej-lineargauge e-enableanimation="false"
                 e-frame-backgroundImageUrl="../images/gauge/Gauge_linear_light.png" >
                 <e-scales>
                 <e-scale  e-width="8"   e-direction="clockwise" e-type="roundedrectangle"
                 e-position-x="60" e-position-y="50" e-backgroundColor="#206BA4" e-border-color="#206BA4"
                 e-border-width="1">
                 <e-ticks>
                 <e-tick e-type="majorinterval" e-width="2" e-color="#206BA4" e-distancefromscale-x="-27"
                 e-distancefromscale-y="0" e-placement="far"></e-tick>
                 <e-tick e-type="minorinterval" e-width="1" e-height="6" e-color="#206BA4"
                 e-distancefromscale-x="-27" e-distancefromscale-y="0" e-placement="far"></e-tick>
                 </e-ticks>
                 </e-scale>
                 </e-scales>
                 </ej-lineargauge>
        </div>
        <script>
        angular.module('LinearGaugeApp', ['ejangular'])
        .controller('LinearGaugeCtrl', function ($scope) {
         });
    </script>
    </body>
</html>
Execute the above code to render the following output.
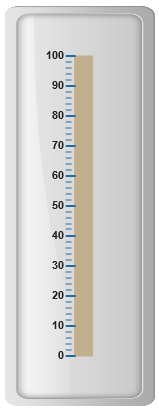
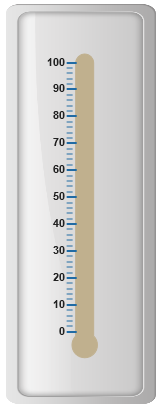
Thermometer
For thermometer scale type, the scale renders as thermometer structure with rounded bottom. Refer the following code example.
<html xmlns="http://www.w3.org/1999/xhtml" lang="en" ng-app="LinearGaugeApp">
    <head>
        <title>Essential Studio for AngularJS: LinearGauge</title>
        <!--CSS and Script file References -->
    </head>
    <body ng-controller="LinearGaugeCtrl">
        <div id="linearframe">
                 <ej-lineargauge e-enableanimation="false"
                 e-frame-backgroundImageUrl="../images/gauge/Gauge_linear_light.png" >
                 <e-scales>
                 <e-scale  e-width="18"  e-length="300" e-type="thermometer"
                 e-position-x="54" e-position-y="50" e-backgroundColor="#C0B08E"
                 e-border-color="#C0B08E" e-border-width="1" e-showmarkerpointers="false"
                 e-showBarPointers="false">
                 <e-ticks>
                 <e-tick e-type="majorinterval" e-width="2" e-color="#206BA4" e-distancefromscale-x="-27"
                 e-distancefromscale-y="0" e-placement="far"></e-tick>
                 <e-tick e-type="minorinterval" e-width="1" e-height="6" e-color="#206BA4"
                 e-distancefromscale-x="-27" e-distancefromscale-y="0" e-placement="far"></e-tick>
                 </e-ticks>
                 </e-scale>
                 </e-scales>
                 </ej-lineargauge>
        </div>
        <script>
        angular.module('LinearGaugeApp', ['ejangular'])
        .controller('LinearGaugeCtrl', function ($scope) {
         });
    </script>
    </body>
</html>
Execute the above code to render the following output.
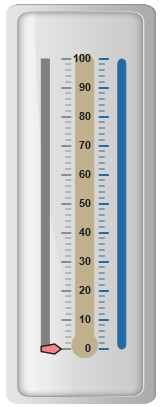
Adding multiple scales
You can set multiple scales for a single Linear Gauge control by using an array of scale objects. Each scale object is independent of each other. Refer the following code example to add multiple scale collection.
<html xmlns="http://www.w3.org/1999/xhtml" lang="en" ng-app="LinearGaugeApp">
    <head>
        <title>Essential Studio for AngularJS: LinearGauge</title>
        <!--CSS and Script file References -->
    </head>
    <body ng-controller="LinearGaugeCtrl">
        <div id="linearframe">
                 <ej-lineargauge e-enableanimation="false"
                 e-frame-backgroundImageUrl="../images/gauge/Gauge_linear_light.png" >
                 <e-scales>
                 <e-scale  e-width="8" e-position-x="15" e-position-y="50"
                 e-backgroundColor="Grey" e-border-color="Grey" e-border-width="1"
                 e-showmarkerpointers="true" e-showBarPointers="false">
                 <e-labels>
                 <e-label e-distancefromscale-x="50" e-distancefromscale-y="0"></e-label>
                 </e-labels>
                 <e-markerpointers>
                 <e-markerpointer e-type="pentagon" e-placement="near" e-width="20" e-length="10"
                 e-backgroundColor="#FE8282" e-distancefromscale="20">
                 </e-markerpointer>
                 </e-markerpointers>
                 <e-ticks>
                 <e-tick e-type="majorinterval" e-width="2" e-color="#8c8c8c" e-distancefromscale-x="30"
                 e-distancefromscale-y="0" ></e-tick>
                 <e-tick e-type="minorinterval" e-width="1" e-height="6" e-color="#8c8c8c"
                 e-distancefromscale-x="30" e-distancefromscale-y="0"></e-tick>
                 </e-ticks>
                 </e-scale>
                 //Adding second scale
                 <e-scale  e-width="8" e-position-x="90" e-position-y="50" e-type="roundedrectangle"
                 e-direction="clockwise" e-backgroundColor="#206BA4" e-border-color="#206BA4"
                 e-border-width="1" e-showmarkerpointers="false" e-showBarPointers="false"
                 e-showLabels="false">
                 <e-ticks>
                 <e-tick e-type="majorinterval" e-width="2" e-color="#206BA4" e-distancefromscale-x="-27"
                 e-distancefromscale-y="0" e-placement="far"></e-tick>
                 <e-tick e-type="minorinterval" e-width="1" e-height="6" e-color="#206BA4"
                 e-distancefromscale-x="-27" e-distancefromscale-y="0" e-placement="far"></e-tick>
                 </e-ticks>
                 </e-scale>
                  //Adding third scale
                 <e-scale  e-width="18" e-length="300" e-position-x="54" e-position-y="50"
                 e-type="thermometer" e-backgroundColor="#C0B08E" e-border-color="#C0B08E"
                 e-border-width="1" e-showmarkerpointers="false" e-showBarPointers="false"
                 e-showLabels="false" e-showTicks="false">
                 </e-scale>
                 </e-scales>
                 </ej-lineargauge>
        </div>
        <script>
        angular.module('LinearGaugeApp', ['ejangular'])
        .controller('LinearGaugeCtrl', function ($scope) {
         });
    </script>
    </body>
</html>
Execute the above code to render the following output.