Getting Started
4 Jan 201824 minutes to read
Before we start with the linear gauge, please refer this page page for general information regarding integrating Syncfusion widget’s.
Adding JavaScript and CSS references
To render the linear gauge control, the following list of external dependencies are needed,
The required angular script as angular.min.js and ej.widget.angular.min.js which can be available in below CDN links:
-
angular.min.js- http://cdn.syncfusion.com/js/assets/external/angular.min.js -
ej.widget.angular.min.js- http://cdn.syncfusion.com/28.1.33/js/common/ej.widget.angular.min.js
The other required internal dependencies are tabulated below,
| Files | Description/Usage |
|---|---|
| ej.core.min.js | It is referred always before using all the JS controls. |
| ej.data.min.js | Used to handle data operation and is used while binding data to the JS controls. |
| ej.lineargauge.min.js | LinearGauge core script file which includes linear gauge related scripts files. |
| ej.excanvas.min.js |
NOTE
Refer the
ej.web.all.min.js(which encapsulates all theejcontrols and frameworks in a single file) in the application instead of referring all the above specified internal dependencies.
To get the real appearance of the linear gauge, the dependent CSS file ej.web.all.min.css (which includes styles of all the widgets) should also needs to be referred.
So the complete boilerplate code is
<!DOCTYPE html>
    <html xmlns="http://www.w3.org/1999/xhtml" lang="en" ng-app="LinearGaugeApp">
    <head>
    <title>Essential Studio for AngularJS: LinearGauge</title>
    <!-- Essential Studio for JavaScript  theme reference -->
    <link href="http://cdn.syncfusion.com/28.1.33/js/web/flat-azure/ej.web.all.min.css" rel="stylesheet" />
    <!-- Essential Studio for JavaScript  script references -->
    <script src="http://cdn.syncfusion.com/js/assets/external/jquery-3.0.0.min.js"></script>
    <script src="http://cdn.syncfusion.com/js/assets/external/angular.min.js"></script>
    <script src="http://cdn.syncfusion.com/28.1.33/js/web/ej.web.all.min.js"></script>
    <script src="http://cdn.syncfusion.com/28.1.33/js/common/ej.widget.angular.min.js" type="text/javascript"></script>
    <!-- Add your custom scripts here -->
    </head>
    <body>
    </body>
    </html>
NOTE
- In production, we highly recommend you to use our
custom script generatorto create custom script file with required controls and its dependencies only. Also to reduce the file size further please useGZip compressionin your server.- For themes, you can use the
ej.web.all.min.cssCDN link from the code snippet given. To add the themes in your application, please refer tothis link.
Create a linear gauge
All the Essential JavaScript directives have been encapsulated into a single module called ejangular so the first step would be to declare dependency for this module within your AngularJS application.
The linear gauge can be created using ej-lineargauge AngularJS directive and its properties can be defined using e- prefix followed by the property name.(For example, e-height)
The code example for defining controls in AngularJS is as follows,
<html xmlns="http://www.w3.org/1999/xhtml" lang="en" ng-app="LinearGaugeApp">
<head>
<title>Essential Studio for AngularJS: LinearGauge</title>
<!--CSS and Script file References -->
</head>
<body ng-controller="LinearGaugeCtrl">
<div id="linearframe">
<ej-lineargauge></ej-lineargauge>
</div>
</body>
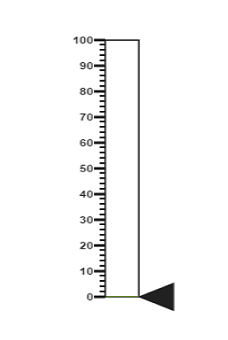
</html>On executing the above code, sample renders a default Linear Gauge with default values as follows.
Set Height and Width values
-
Basic attributes of each canvas elements are height and width properties.
-
You can set the height and width of the gauge as shown in the following code example.
<ej-lineargauge e-height="550" e-width="500">
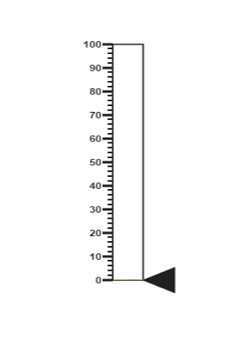
</ej-lineargauge>On executing the above code sample renders a default Linear Gauge with height and width.
Set animate option and Label Color
-
You can draw the Thermometer with Label color and set animate property to true.
-
Initially set the animate property to false to avoid unwanted script loads.
<ej-lineargauge e-height="550" e-width="500" e-labelcolor="#8c8c8c" e-enableanimation="false">
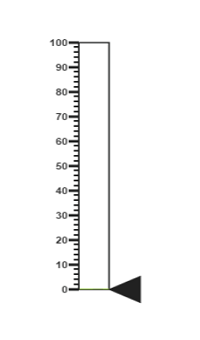
</ej-lineargauge>On executing the above code sample renders a customized Linear Gauge as follows.
Provide scale values
-
You can change the Scale Style of Thermometer using type property.
-
You can set the Minimum temperature up to -10 and maximum body temperature up to 110.
-
You can set the Minimum scale value as -10 and maximum value as 110.
-
You can set the Location values such as vertical and horizontal position in the thermometer.
-
You can set the thermometer height using length property.
-
You can set the Minor Interval value as 5 to get the exact temperature of the patient.
<ej-lineargauge e-height="550" e-width="500" e-labelcolor="#8c8c8c" e-enableanimation="false">
<e-scales>
<e-scale e-type="thermometer" e-backgroundcolor="transparent" e-minimum="-10" e-maximum="110"
e-minorintervalvalue="5" e-width="20" e-position-x="50" e-position-y="18" e-length="355"
e-border-width="0.5">
//Add the pointers customization code here
//Add the labels customization code here
//Add the ticks customization code here
//Add the Custom labels customization code here
</e-scale>
</e-scales>
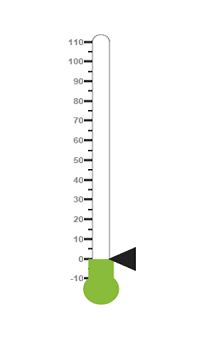
</ej-lineargauge>On executing the above code sample renders a customized gauge with ranges as follows.
Add pointers data
In Linear gauge there are two types of pointers available such as marker pointer and bar pointer.
-
Marker pointer displays as a pointer device which shows the actual values. In this example, there is no need to show a marker pointer in a thermometer, therefore, you can hide it by setting the Opacity property to ‘0’.
-
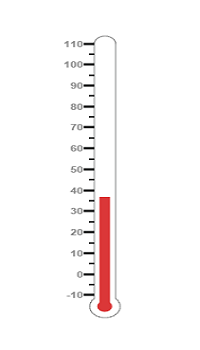
Bar pointer displays as a mercury metal that shows the exact temperature of the person. You can set the basic properties of the bar pointer such as width, distanceFromScale, Value and backgroundColor.
<ej-lineargauge e-height="550" e-width="500" e-labelcolor="#8c8c8c" e-enableanimation="false">
    <e-scales>
       <e-scale e-type="thermometer" e-backgroundcolor="transparent" e-minimum="-10" e-maximum="110"
       e-minorintervalvalue="5" e-width="20" e-position-x="50" e-position-y="18" e-length="355"
       e-border-width="0.5">
       <e-markerpointers>
               <e-markerpointer e-opacity="0"></e-markerpointer>
       </e-markerpointers>
       <e-barpointers>
              <e-barpointer  e-width="10" e-distancefromscale="-0.5" e-value="37"
              e-backgroundcolor="#DB3738"></e-barpointer>
        </e-barpointers>
        //Add the labels customization code here
        //Add the ticks customization code here
        //Add the Custom labels customization code here
        </e-scale>
    </e-scales>
</ej-lineargauge>
On executing the above code sample renders a Linear Gauge with bar marker as follows.
Add Label Customization
-
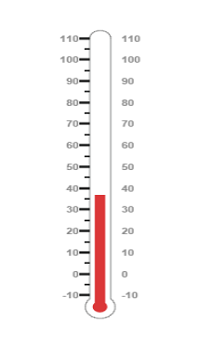
You can display the label value on both sides to get temperature in different scales. For that you can add two label values in an array.
-
You can use the scale labels to display the value in the gauge. You can customize the label placement, font (including its style and family) and its distance from scale.
<ej-lineargauge e-height="550" e-width="500" e-labelcolor="#8c8c8c" e-enableanimation="false">
    <e-scales>
       <e-scale>
        //Add the labels customization code here
        //Add the ticks customization code here
        //Add the Custom labels customization code here
          <e-labels>
             <e-label e-placement="near">
                <e-font e-size="10px" e-fontfamily="Segoe UI" e-fontstyle="Normal"></e-font>
             </e-label>
             <e-label e-placement="far" e-distanceFromScale-x="10"></e-label>
          </e-labels>
        //Add the ticks customization code here
        //Add the Custom labels customization code here
        </e-scale>
    </e-scales>
</ej-lineargauge>
On executing the above code sample renders a customized Linear Gauge as follows.
Add Ticks Details
-
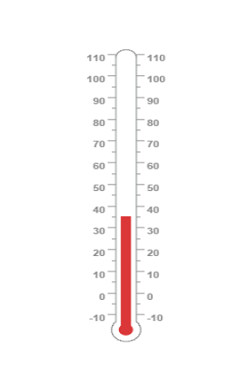
You can set the width and height of the major ticks greater than the Minor ticks. You can set dark background for tick Color to have a better visibility.
-
You can also use four ticks for both the sides, each having two minor ticks and major ticks.
<ej-lineargauge e-height="550" e-width="500" e-labelcolor="#8c8c8c" e-enableanimation="false">
    <e-scales>
       <e-scale>
            //Add the pointers customization code here
            //Add the labels customization code here
            //Add the ticks customization code here
            <e-ticks>
              <e-tick e-type="majorinterval" e-height="8" e-width="1" e-color="#8c8c8c"
              e-distancefromscale-y="-4"></e-tick>
              <e-tick e-type="minorinterval" e-height="4" e-width="1" e-color="#8c8c8c"
              e-distancefromscale-y="-4"></e-tick>
              <e-tick e-type="majorinterval" e-placement="far" e-height="8" e-width="1"
              e-color="#8c8c8c" e-distancefromscale-y="-4">
              </e-tick>
              <e-tick e-type="minorinterval" e-placement="far" e-height="4" e-width="1"
              e-color="#8c8c8c" e-distancefromscale-y="-4">
              </e-tick>
            </e-ticks>
            //Add the Custom labels customization code here
        </e-scale>
    </e-scales>
</ej-lineargauge>
On executing the above code sample renders a Linear Gauge with custom labels as follows.
Add Custom Label Details
-
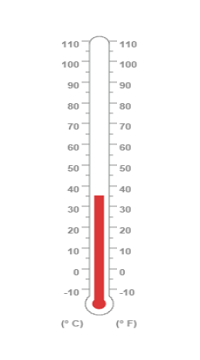
You can specify the texts using Custom labels which displays in the gauge and customize them using various properties.
-
You can change the showIndicators property as true to show the custom labels.
The following code example illustrates how to use custom texts.
<ej-lineargauge e-height="550" e-width="500" e-labelcolor="#8c8c8c" e-enableanimation="false">
    <e-scales>
       <e-scale>
             //Add the pointers customization code here
             //Add the labels customization code here
             //Add the ticks customization code here
             //Add the Custom labels customization code here
            <e-customlabels>
               <e-customlabel e-value="(° C)" e-position-x="44" e-position-y="78">
                  <e-font e-size="12px" e-fontfamily="Segoe UI" e-fontstyle="Bold"></e-font>
               </e-customlabel>
               <e-customlabel e-value="(° F)" e-position-x="56" e-position-y="78">
                  <e-font e-size="12px" e-fontfamily="Segoe UI" e-fontstyle="Bold"></e-font>
               </e-customlabel>
               <e-customlabel e-position-x="51" e-position-y="90">
                  <e-font e-size="13px" e-fontfamily="Segoe UI" e-fontstyle="Bold"></e-font>
               </e-customlabel>
            </e-customlabels>
        </e-scale>
    </e-scales>
</ej-lineargauge>
On executing the above code sample renders a customized Linear Gauge as follows.
Change scale Degree to Fahrenheit
You can add a function to convert the temperature from Degrees to Fahrenheit values in the label by having index value as 1.
<div id="linearframe">
<ej-lineargauge e-height="550" e-width="500" e-labelcolor="#8c8c8c" e-enableanimation="false"
e-drawlabels="DrawLabel">
</ej-lineargauge>
</div>
<script>
        function DrawLabel(args) {
            if (args.label.index == 1) {
                args.style.textValue = (args.label.value * (9 / 5)) + 32;
                args.style.font = "Normal 10px Segoe UI";
            }
        }
</script>
On executing the above code sample renders a Linear Gauge with values in Degrees and Fahrenheit as follows.
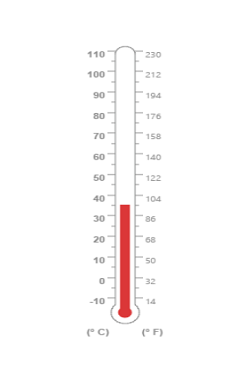
Add Custom label for Current Value
You can add the function that displays the current temperature value in the custom label.
<div id="linearframe">
<ej-lineargauge e-height="550" e-width="500" e-labelcolor="#8c8c8c" e-enableanimation="false"
e-drawlabels="DrawLabel">
</ej-lineargauge>
</div>
<script>
        function DrawCustomLabel(args) {
            if (args.customLabelIndex == 2) {
                var temp = args.scaleElement.barPointers[0].value;
                var faValue = (temp * (9 / 5)) + 32;
                if (temp == -10) {
                    args.style.textValue = "Very Cold Weather" + "(" + faValue.toFixed(1) + "° F)";
                }
                else if ((temp > -10 && temp < 0) || (temp > 0 && temp < 15)) {
                    args.style.textValue = "Cool Weather" + " (" + faValue.toFixed(1) + "° F)";
                }
                else if (temp == 0) {
                    args.style.textValue ="Freezing point of Water" + "(" + faValue.toFixed(1) + "° F)";
                }
                else if (temp >= 15 && temp < 30) {
                    args.style.textValue = "Room Temperature" + " (" + faValue.toFixed(1) + "° F)";
                }
                else if (temp == 30) {
                    args.style.textValue = "Beach Weather" + " (" + faValue.toFixed(1) + "° F)";
                }
                else if (temp == 37) {
                    args.style.textValue = "Body Temperature" + " (" + faValue.toFixed(1) + "° F)";
                }
                else if (temp == 40) {
                    args.style.textValue = "Hot Bath Temperature" + " (" + faValue.toFixed(1) + "° F)";
                }
                else if (temp > 40 && temp < 100) {
                    args.style.textValue = "Very Hot Temperature" + " (" + faValue.toFixed(1) + "° F)";
                }
                else if (temp == 100) {
                    args.style.textValue ="Boiling point of Water" + "(" + faValue.toFixed(1) + "° F)";
                }
            }
        }
</script>
The following screen shot displays a linear gauge with all the customizations discussed earlier.