Getting Started
5 Jan 201823 minutes to read
Before we start with the bullet graph, please refer this page page for general information regarding integrating Syncfusion widget’s.
Adding JavaScript and CSS references
To render the bullet graph control, the following list of external dependencies are needed,
The required Angular script as angular.min.js and ej.widget.angular.min.js which can be available in below CDN links:
-
angular.min.js- http://cdn.syncfusion.com/js/assets/external/angular.min.js -
ej.widget.angular.min.js- http://cdn.syncfusion.com/28.1.33/js/common/ej.widget.angular.min.js
The other required internal dependencies are tabulated below,
| Files | Description/Usage |
|---|---|
| ej.core.min.js | It is referred always before using all the JS controls. |
| ej.data.min.js | Used to handle data operation and is used while binding data to the JS controls. |
| ej.bulletgraph.min.js | Bullet graph core script file which includes bullet graph related scripts files. |
NOTE
Refer the
ej.web.all.min.js(which encapsulates all theejcontrols and frameworks in a single file) in the application instead of referring all the above specified internal dependencies.
To get the real appearance of the bullet graph, the dependent CSS file ej.web.all.min.css (which includes styles of all the widgets) should also needs to be referred.
So the complete boilerplate code is
<!DOCTYPE html>
    <html xmlns="http://www.w3.org/1999/xhtml" lang="en" ng-app="BulletGraphApp">
    <head>
    <title>Essential Studio for AngularJS: BulletGraph</title>
    <!-- Essential Studio for JavaScript  theme reference -->
    <link href="http://cdn.syncfusion.com/28.1.33/js/web/flat-azure/ej.web.all.min.css" rel="stylesheet" />
    <!-- Essential Studio for JavaScript  script references -->
    <script src="http://cdn.syncfusion.com/js/assets/external/jquery-3.0.0.min.js"></script>
    <script src="http://cdn.syncfusion.com/js/assets/external/jsrender.min.js"></script>
    <script src="http://cdn.syncfusion.com/js/assets/external/angular.min.js"></script>
    <script src="http://cdn.syncfusion.com/28.1.33/js/web/ej.web.all.min.js"></script>
    <script src="http://cdn.syncfusion.com/28.1.33/js/common/ej.widget.angular.min.js" type="text/javascript"></script>
    <!-- Add your custom scripts here -->
    </head>
    <body>
    </body>
    </html>
NOTE
- In production, we highly recommend you to use our
custom script generatorto create custom script file with required controls and its dependencies only. Also to reduce the file size further please useGZip compressionin your server.- For themes, you can use the
ej.web.all.min.cssCDN link from the code snippet given. To add the themes in your application, please refer tothis link.
Create a bullet graph
All the Essential JavaScript directives have been encapsulated into a single module called ejangular so the first step would be to declare dependency for this module within your AngularJS application.
The bullet graph can be created using ej-bulletgraph AngularJS directive and its properties can be defined using e- prefix followed by the property name.(For example, e-height)
The code example for defining controls in AngularJS is as follows,
<html xmlns="http://www.w3.org/1999/xhtml" lang="en" ng-app="BulletGraphApp">
    <head>
        <title>Essential Studio for AngularJS: BulletGraph</title>
        <!--CSS and Script file References -->
    </head>
    <body ng-controller="BulletGraphCtrl">
        <div id="bulletframe">
                 <ej-bulletgraph></ej-bulletgraph>
        </div>
    </body>
</html>
On executing the above code, sample renders a default Bullet Graph with default values as follows.
##Provide Required Data
You can customize the values of feature and comparative measure bars in a BulletGraph, either locally or remotely. The category data is optional, and is used to display label values in parallel to the measure bars.
Assign the data in localData variable to the dataSource property of BulletGraph as shown in the following code example.
<div id="frame">
        <ej-bulletgraph e-fields-dataSource="data"></ej-bulletgraph>
    </div>

    <script>
          angular.module('BulletGraphApp', ['ejangular'])
            .controller('BulletGraphCtrl', function ($scope) {
                $scope.data = localData;
             });

               var localData = [
               {
                   value: 90, comparativeMeasureValue: 100,
                   category: 2013
               },
               {
                   value: 93, comparativeMeasureValue: 99,
                   category: 2012
               },
               {
                   value: 98, comparativeMeasureValue: 96,
                   category: 2011
               },
               {
                   value: 102, comparativeMeasureValue: 98,
                   category: 2010
               },
               {
                   value: 77, comparativeMeasureValue: 96,
                   category: 2009
               },
               {
                   value: 99, comparativeMeasureValue: 99,
                   category: 2008
               },
               {
                   value: 106, comparativeMeasureValue: 94,
                   category: 2007
               },
               {
                   value: 105, comparativeMeasureValue: 95,
                   category: 2006
               },
               {
                   value: 98, comparativeMeasureValue: 98,
                   category: 2005
               },
               {
                   value: 87, comparativeMeasureValue: 100,
                   category: 2004
               },
               {
                   value: 105, comparativeMeasureValue: 98,
                   category: 2003
               },
               {
                   value: 84, comparativeMeasureValue: 101,
                   category: 2002
               },
               {
                   value: 93, comparativeMeasureValue: 98,
                   category: 2001
               },
               {
                   value: 90, comparativeMeasureValue: 96,
                   category: 2000
               },
               {
                   value: 95, comparativeMeasureValue: 107,
                   category: 1999
               },
               {
                   value: 104, comparativeMeasureValue: 98,
                   category: 1998
               },
               {
                   value: 102, comparativeMeasureValue: 92,
                   category: 1997
               },
               {
                   value: 103, comparativeMeasureValue: 98,
                   category: 1996
               },
               {
                   value: 100, comparativeMeasureValue: 96,
                   category: 1995
               },
               {
                   value: 110, comparativeMeasureValue: 92,
                   category: 1994
               },
               {
                   value: 100, comparativeMeasureValue: 103,
                   category: 1993
               },
               {
                   value: 94, comparativeMeasureValue: 93,
                   category: 1992
               },
               {
                   value: 91, comparativeMeasureValue: 95,
                   category: 1991
               },
               {
                   value: 107, comparativeMeasureValue: 103,
                   category: 1990
               },
               {
                   value: 101, comparativeMeasureValue: 102,
                   category: 1989
               },
               {
                   value: 119, comparativeMeasureValue: 112,
                   category: 1988
               }];

    </script>
Once the dataSource property is assigned with the required values, you can bind the variable names used in the JSON data to the corresponding fields of the BulletGraph as shown in the following code sample.
<ej-bulletgraph e-fields-datasource="data"  e-fields-category="category"
                e-fields-featureMeasures="value"
                e-fields-comparativeMeasure="comparativeMeasureValue">
</ej-bulletgraph>
Set Default and Scale Values
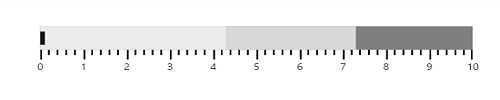
You can plot more number of measure bars within the BulletGraph, the height and width of the control should be increased to locate all the measure bars within the graph.The qualitativeRangeSize and quantitativeScaleLength property needs to be set accordingly as shown in the following code example.
By default, the BulletGraph is rendered in the Horizontal orientation with its flow direction set to Forward.
Minimum, maximum and interval values for the quantitativeScale of the bullet graph should be set, as shown in the following code example.
<ej-bulletgraph e-height="540" e-width="850" e-qualitativerangesize="800"
                e-quantitativescalelength="420" e-orientation="vertical"
                e-flowdirection="backward" e-quantitativescalesettings-interval="10"
                e-quantitativescalesettings-minimum="70" e-quantitativescalesettings-maximum="130"
                e-quantitativescalesettings-tickPosition="near" e-labelsettings-position="above"
                e-fields-datasource="data" e-fields-category="category" e-fields-featureMeasures="value"
                e-fields-comparativeMeasure="comparativeMeasureValue">
</ej-bulletgraph>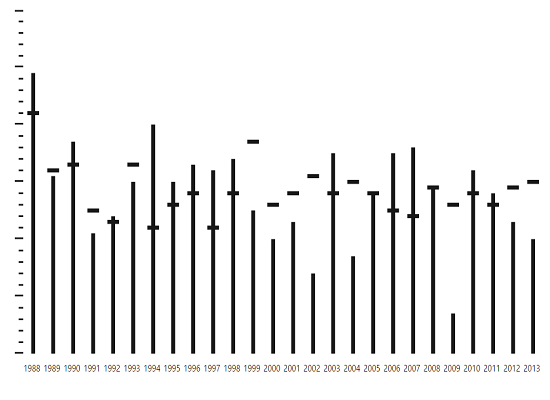
As you can see in the image above, the bullet graph without any ranges is displayed in the background. The steps to add the qualitativeRanges are described in the next section.
Add Qualitative Ranges
By default, 3 ranges are displayed in the BulletGraph control during the initial rendering of the control with its default values. In order to customize it, you need to set appropriate values for the rangeEnd and its rangeStroke properties. Any number of qualitativeRanges can be added to the control.
<ej-bulletgraph>
<e-qualitativeranges>
<e-qualitativerange e-rangeend="90"></e-qualitativerange>
<e-qualitativerange e-rangeend="110"></e-qualitativerange>
<e-qualitativerange e-rangeend="130" e-rangestroke="#CDC9C9"></e-qualitativerange>
</e-qualitativeranges>
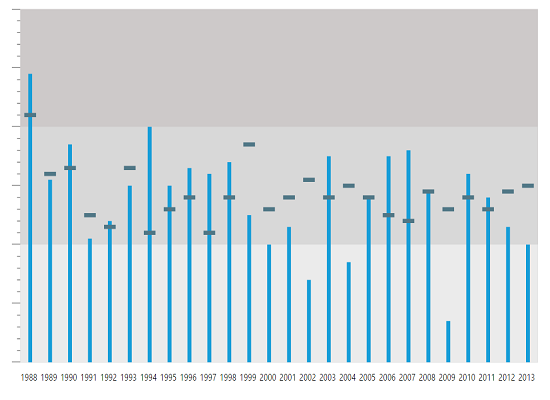
</ej-bulletgraph>After adding qualitativeRanges to the BulletGraph, the control will be rendered as follows.
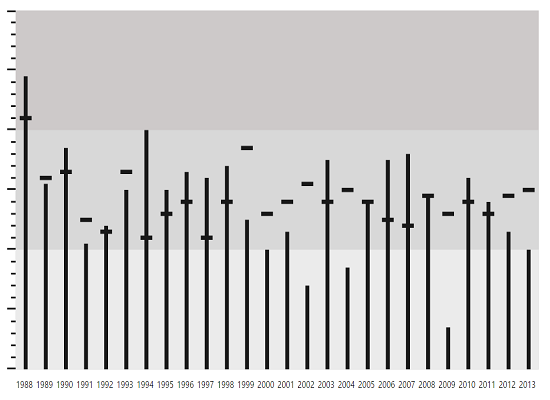
Ticks and Measure Bars Customization
You have to do the following code changes in the quantitative scale in order to customize the tick size, the colors of the feature bar and comparative measure symbols.
<ej-bulletgraph e-quantitativescalesettings-majorTickSettings-width="1"
                 e-quantitativescalesettings-majorTickSettings-size="13"
                 e-quantitativescalesettings-majorTickSettings-stroke="gray"
                 e-quantitativescalesettings-minorTickSettings-width="1"
                 e-quantitativescalesettings-minorTickSettings-size="5"
                 e-quantitativescalesettings-minorTickSettings-stroke="gray"
                 e-quantitativescalesettings-comparativeMeasureSettings-stroke="#507786"
                 e-quantitativescalesettings-featuredMeasureSettings-stroke="#169DD8">
</ej-bulletgraph>
When customization of ticks and measure bars is done, BulletGraph looks as follows
Add Caption and Subtitle
You can display an appropriate Caption and Subtitle in the BulletGraph by adding the following code example.
<ej-bulletgraph e-captionsettings-textposition='Top' e-captionsettings-textalignment='Center'
e-captionsettings-textAnchor='middle'
e-captionsettings-text="Monsoon Rainfall - Actual vs Forecast"
e-captionsettings-font-color="null" e-captionsettings-font-fontFamily="segoe ui"
e-captionsettings-font-fontStyle="normal" e-captionsettings-font-size="12px"
e-captionsettings-font-fontWeight="regular" e-captionsettings-font-opacity="1"
e-captionsettings-subtitle-textAngle="-90" e-captionsettings-subtitle-text="Rainfall (mm)"
e-captionsettings-subtitle-location-x="15" e-captionsettings-subtitle-location-y="250"
e-captionsettings-subtitle-font-color="null" e-captionsettings-subtitle-font-fontFamily="segoe ui"
e-captionsettings-subtitle-font-fontStyle="normal" e-captionsettings-subtitle-font-size="12px"
e-captionsettings-subtitle-font-fontWeight="regular" e-captionsettings-subtitle-font-opacity="1">
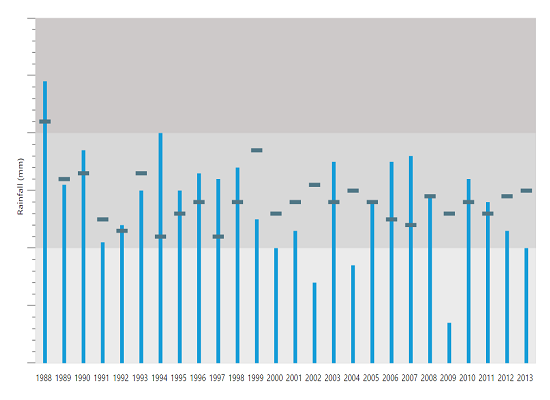
</ej-bulletgraph>The following screenshot displays a BulletGraph in the caption and title in the BulletGraph.
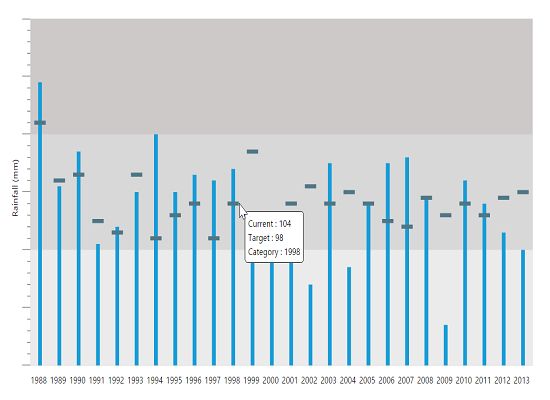
Show Tooltip
You can use a Tooltip in your application to display any information. The tooltip is enabled by setting the visible property in tooltip to true.
<ej-bulletgraph  e-tooltipsettings-visible="true">
</ej-bulletgraph>
By using the customization options discussed in this section, the BulletGraph is rendered as displayed on the following screenshot.