Bullet Graph Dimensions
8 Mar 201811 minutes to read
This section explains you on how to change the dimensions of the Bullet Graph. You can change various dimensions and properties of Bullet Graph like width, height, quantitative scale length, qualitative range size etc. By default, Bullet Graph uses 595 pixel width and 90 pixel height. You can customize width and height of a Bullet Graph using width and height properties of Bullet Graph respectively.
Size
<html xmlns="http://www.w3.org/1999/xhtml" lang="en" ng-app="BulletGraphApp">
<head>
<title>Essential Studio for AngularJS: BulletGraph</title>
<!--CSS and Script file References -->
</head>
<body ng-controller="BulletGraphCtrl">
<div id="bulletframe">
<ej-bulletgraph e-width="500" e-height="100"></ej-bulletgraph>
</div>
<script type="javascript">
angular.module('BulletGraphApp', ['ejangular'])
.controller('BulletGraphCtrl', function ($scope) {
});
</script>
</body>
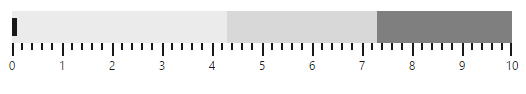
</html>In the above code example, width is set as 500 pixel and height is set as 100 pixel. The output of the above code example with dimension 500 * 100 is as follows.
Value for performance bar
The feature measure bar value is customized using the value property. Default value of this property is 0.
<html xmlns="http://www.w3.org/1999/xhtml" lang="en" ng-app="BulletGraphApp">
<head>
<title>Essential Studio for AngularJS: BulletGraph</title>
<!--CSS and Script file References -->
</head>
<body ng-controller="BulletGraphCtrl">
<div id="bulletframe">
<ej-bulletgraph e-value="5"></ej-bulletgraph>
</div>
<script type="javascript">
angular.module('BulletGraphApp', ['ejangular'])
.controller('BulletGraphCtrl', function ($scope) {
});
</script>
</body>
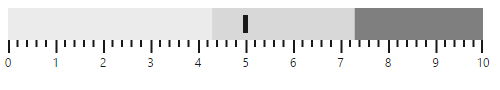
</html>The following screenshot displays Bullet Graph with a performance measure value of 5.
Comparative measure value
The Comparative measure value is set using comparativeMeasureValue property. The default value of this property is 0.
<html xmlns="http://www.w3.org/1999/xhtml" lang="en" ng-app="BulletGraphApp">
<head>
<title>Essential Studio for AngularJS: BulletGraph</title>
<!--CSS and Script file References -->
</head>
<body ng-controller="BulletGraphCtrl">
<div id="bulletframe">
<ej-bulletgraph e-comparativemeasurevalue="5"></ej-bulletgraph>
</div>
<script type="text/javascript">
angular.module('BulletGraphApp', ['ejangular'])
.controller('BulletGraphCtrl', function ($scope) {
});
</script>
</body>
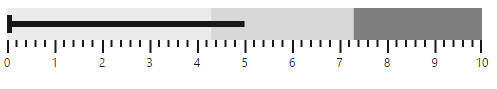
</html>The following screenshot displays Bullet Graph with comparative measure value of 5.
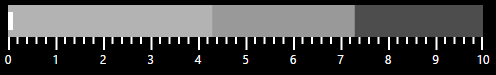
Theme
Bullet Graph Theme is customized using theme property. Default value is FlatLight. Bullet Graph supports FlatLight and FlatDark themes. FlatDark theme improves Bullet Graph appearance when background of Bullet Graph container uses dark color like black.
<html xmlns="http://www.w3.org/1999/xhtml" lang="en" ng-app="BulletGraphApp">
    <head>
        <title>Essential Studio for AngularJS: BulletGraph</title>
        <!--CSS and Script file References -->
    </head>
    <body ng-controller="BulletGraphCtrl">
        <div id="bulletframe">
                 <ej-bulletgraph e-theme="FlatDark"></ej-bulletgraph>
        </div>
     <script type="text/javascript">
           angular.module('BulletGraphApp', ['ejangular'])
           .controller('BulletGraphCtrl', function ($scope) {
                 });
     </script>
     </body>
    </html>
The following screenshot displays Bullet Graph with FlatDark theme
Orientation
Bullet Graph is oriented either horizontally or vertically using orientation property. Default value of this property is horizontal.
<html xmlns="http://www.w3.org/1999/xhtml" lang="en" ng-app="BulletGraphApp">
<head>
<title>Essential Studio for AngularJS: BulletGraph</title>
<!--CSS and Script file References -->
</head>
<body ng-controller="BulletGraphCtrl">
<div id="bulletframe">
<ej-bulletgraph e-width="100" e-height="550" e-orientation="vertical" e-flowdirection="backward"></ej-bulletgraph>
</div>
<script type="text/javascript">
angular.module('BulletGraphApp', ['ejangular'])
.controller('BulletGraphCtrl', function ($scope) {
});
</script>
</body>
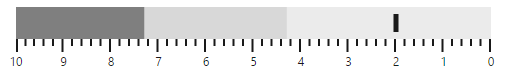
</html>Flow direction
The Flow direction of Bullet Graph is customized using flowDirection property. Default value of this property is forward. Setting forward renders Bullet Graph left to right and backward renders from right to left.
<html xmlns="http://www.w3.org/1999/xhtml" lang="en" ng-app="BulletGraphApp">
    <head>
        <title>Essential Studio for AngularJS: BulletGraph</title>
        <!--CSS and Script file References -->
    </head>
    <body ng-controller="BulletGraphCtrl">
        <div id="bulletframe">
                 <ej-bulletgraph e-comparativemeasurevalue="2"  e-flowdirection="backward"></ej-bulletgraph>
        </div>
     <script type="text/javascript">
           angular.module('BulletGraphApp', ['ejangular'])
           .controller('BulletGraphCtrl', function ($scope) {
                 });
     </script>
     </body>
    </html>
The following screenshot displays Bullet Graph in a backward direction.
Qualitative range size
Size of the Qualitative range is customized using qualitativeRangeSize property. Default value of this property is 32.
<html xmlns="http://www.w3.org/1999/xhtml" lang="en" ng-app="BulletGraphApp">
<head>
<title>Essential Studio for AngularJS: BulletGraph</title>
<!--CSS and Script file References -->
</head>
<body ng-controller="BulletGraphCtrl">
<div id="bulletframe">
<ej-bulletgraph e-qualitativerangesize="50"></ej-bulletgraph>
</div>
<script type="text/javascript">
angular.module('BulletGraphApp', ['ejangular'])
.controller('BulletGraphCtrl', function ($scope) {
});
</script>
</body>
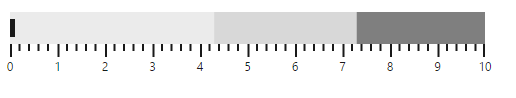
</html>The following screenshot displays Bullet Graph with Qualitative range of size 50
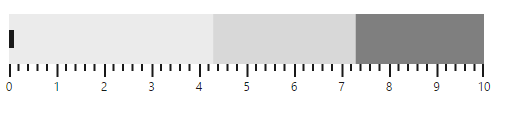
Quantitative scale length
Length of the Quantitativescale is customized using quantitativeScaleLength property. Default value of this property is 475.
<html xmlns="http://www.w3.org/1999/xhtml" lang="en" ng-app="BulletGraphApp">
    <head>
        <title>Essential Studio for AngularJS: BulletGraph</title>
        <!--CSS and Script file References -->
    </head>
    <body ng-controller="BulletGraphCtrl">
        <div id="bulletframe">
                 <ej-bulletgraph e-width="100" e-quantitativescalelength="500"></ej-bulletgraph>
        </div>
     <script type="text/javascript">
           angular.module('BulletGraphApp', ['ejangular'])
           .controller('BulletGraphCtrl', function ($scope) {
                 });
     </script>
     </body>
    </html>
The following screenshot displays Bullet Graph with Quantitative scale length of 500.