How can I help you?
Getting Started
This section explains briefly about how to create a PivotGrid control in your application with Angular. This section covers only the minimal features that you need to know to get started with the PivotGrid.
Getting started with SystemJS
To quick start with Syncfusion JavaScript Angular components run the below commands to clone the repository for SystemJS starter and installing required dependency packages.
> git clone https://github.com/syncfusion/angular2-seeds/ -b systemjs

 > cd angular2-seeds

 > npm install
The below steps describes to add component with above cloned seed application.
Syncfusion JavaScript components source configuration and sample creation
- Copy required Syncfusion Angular source component(s) from the below build location and add it in
src/ejfolder (For ex., consider thepivotgridcomponent).
(Installed Location)\Syncfusion\Essential Studio\32.2.3\JavaScript\assets-src\angular2\NOTE
core.tsfile is mandatory for all Syncfusion JavaScript Angular components. The repository having the source file from Essential Studio for JavaScript v32.2.3.
-
Create
pivotgridfolder insidesrcfolder. -
Create
pivotgrid.component.htmlview file insidesrc/pivotgridfolder and render ejPivotGrid Angular component using the below code example.
<ej-pivotgrid></ej-pivotgrid>- Create
pivotgrid.component.tsmodel file inside the foldersrc/pivotgridand create sample component using the below code example.
import { Component } from '@angular/core';

@Component({
  selector: 'ej-app',
  templateUrl: 'app/components/pivotgrid/pivotgrid.component.html',
  styleUrls: ['app/components/pivotgrid/pivotgrid.component.css'],
})

export class PivotGridComponent {
    //..
}
Configure the routes for the Router
Before adding router configuration for above created ejPivotGrid component, we recommend you to go through the Angular Routing configuration to get the deeper knowledge about Angular routing.
- Now, we are going to configure the route navigation link for created PivotGrid sample in
src/app.component.htmlfile.
<div>
	<ul class="nav navbar-nav">
		. . . .
		<li><a data-toggle="collapse" data-target="#skeleton-navigation-navbar-collapse.in" href="#pivotgrid" [routerLink]="['/pivotgrid']">PivotGrid </a></li>
	</ul>
</div>
<main>
	<router-outlet></router-outlet>
</main>- Import the ejPivotGrid sample component and define the route in
src/app.routes.tsfile.
import { Routes } from '@angular/router';
. . . .
import { PivotGridComponent } from './pivotgrid/pivotgrid.component';

export const rootRouterConfig: Routes = [
    { path: '', redirectTo: 'home', pathMatch: 'full' },
    . . . .
    { path: 'pivotgrid', component: PivotGridComponent }
];- Import and declare the Syncfusion source component and ejPivotGrid sample component into
app.module.tslike the below code snippet.
import { NgModule, enableProdMode, ErrorHandler } from '@angular/core';
. . . . .
import { EJ_PIVOTGRID_COMPONENTS } from './ej/pivotgrid.component';
import { PivotGridComponent } from './pivotgrid/pivotgrid.component';

import { rootRouterConfig } from './app.routes';
. . . .
@NgModule({
  imports: [BrowserModule, FormsModule, HttpModule, RouterModule.forRoot(rootRouterConfig, { useHash: true })],
  declarations: [. . . . , EJ_PIVOTGRID_COMPONENTS,PivotGridComponent],
  bootstrap: [AppComponent]
})
export class AppModule { }
Relational
This section covers the information that you need to know to populate a simple PivotGrid with Relational data source.
Control Initialization
Add necessary HTML elements in pivotgrid.component.html to render PivotGrid
<ej-pivotgrid [enableToolTip]="false" [dataSource.data]="data" [dataSource.rows]="rows" [dataSource.columns]="columns" [dataSource.values]="values">
 </ej-pivotgrid>
Create a CSS page and add necessary CSS elements for PivotGrid
ej-pivotgrid {
        display: block;
        height: 450px;
        width: 100%;
        overflow: auto;
    }

    .e-pivotgrid {
        position: inherit !important;
}
Populate PivotGrid with data
Let us now see how to populate the PivotGrid control using a sample JSON data as shown below.
<ej-pivotgrid [enableToolTip]="false" [dataSource.data]="data" [dataSource.rows]="rows" [dataSource.columns]="columns" [dataSource.values]="values" [dataSource.filters]="filters">
    </ej-pivotgrid>
//..
export class PivotGridComponent {
public data; rows; columns;values;filters;
constructor() {
this.data = [
{ Amount: 100, Country: "Canada", Date: "FY 2005", Product: "Bike", Quantity: 2, State: "Alberta" },
{ Amount: 200, Country: "Canada", Date: "FY 2006", Product: "Van", Quantity: 3, State: "British Columbia" },
{ Amount: 300, Country: "Canada", Date: "FY 2007", Product: "Car", Quantity: 4, State: "Brunswick" },
{ Amount: 150, Country: "Canada", Date: "FY 2008", Product: "Bike", Quantity: 3, State: "Manitoba" },
{ Amount: 200, Country: "Canada", Date: "FY 2006", Product: "Car", Quantity: 4, State: "Ontario" },
{ Amount: 100, Country: "Canada", Date: "FY 2007", Product: "Van", Quantity: 1, State: "Quebec" },
{ Amount: 200, Country: "France", Date: "FY 2005", Product: "Bike", Quantity: 2, State: "Charente-Maritime" },
{ Amount: 250, Country: "France", Date: "FY 2006", Product: "Van", Quantity: 4, State: "Essonne" },
{ Amount: 300, Country: "France", Date: "FY 2007", Product: "Car", Quantity: 3, State: "Garonne (Haute)" },
{ Amount: 150, Country: "France", Date: "FY 2008", Product: "Van", Quantity: 2, State: "Gers" },
{ Amount: 200, Country: "Germany", Date: "FY 2006", Product: "Van", Quantity: 3, State: "Bayern" },
{ Amount: 250, Country: "Germany", Date: "FY 2007", Product: "Car", Quantity: 3, State: "Brandenburg" },
{ Amount: 150, Country: "Germany", Date: "FY 2008", Product: "Car", Quantity: 4, State: "Hamburg" },
{ Amount: 200, Country: "Germany", Date: "FY 2008", Product: "Bike", Quantity: 4, State: "Hessen" },
{ Amount: 150, Country: "Germany", Date: "FY 2007", Product: "Van", Quantity: 3, State: "Nordrhein-Westfalen" },
{ Amount: 100, Country: "Germany", Date: "FY 2005", Product: "Bike", Quantity: 2, State: "Saarland" },
{ Amount: 150, Country: "United Kingdom", Date: "FY 2008", Product: "Bike", Quantity: 5, State: "England" },
{ Amount: 250, Country: "United States", Date: "FY 2007", Product: "Car", Quantity: 4, State: "Alabama" },
{ Amount: 200, Country: "United States", Date: "FY 2005", Product: "Van", Quantity: 4, State: "California" },
{ Amount: 100, Country: "United States", Date: "FY 2006", Product: "Bike", Quantity: 2, State: "Colorado" },
{ Amount: 150, Country: "United States", Date: "FY 2008", Product: "Car", Quantity: 3, State: "New Mexico" },
{ Amount: 200, Country: "United States", Date: "FY 2005", Product: "Bike", Quantity: 4, State: "New York" },
{ Amount: 250, Country: "United States", Date: "FY 2008", Product: "Car", Quantity: 3, State: "North Carolina" },
{ Amount: 300, Country: "United States", Date: "FY 2007", Product: "Van", Quantity: 4, State: "South Carolina" }
];
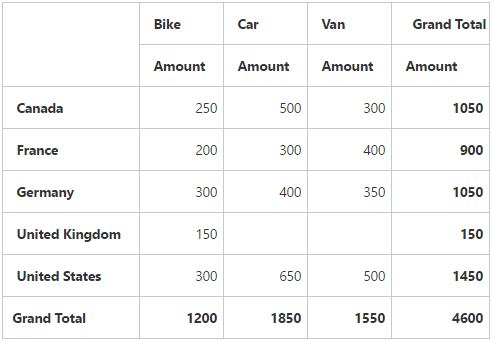
this.rows= [{ fieldName: "Country", fieldCaption: "Country" }],
this.columns= [{ fieldName: "Product", fieldCaption: "Product" }],
this.values= [{ fieldName: "Amount", fieldCaption: "Amount" }],
this.filters= []
}
}The above code will generate a simple PivotGrid with “Country” field in Row, “Product” field in Column and “Amount” field in Value section.
Apply Sorting
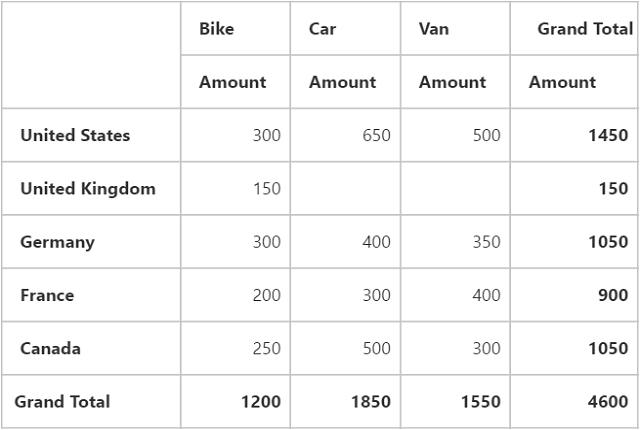
You can sort a field either to ascending or descending order using the “sortOrder” property. Sorting is applicable only for Row and Column fields. By default, fields are arranged in ascending order.
//..

export class PivotGridComponent {
    public data; rows; columns;values;filters;
    constructor() {
        this.data = []; // data source
        this.rows= [{ fieldName: "Country", fieldCaption: "Country", sortOrder: ej.PivotAnalysis.SortOrder.Descending }],
        this.columns= [{ fieldName: "Product", fieldCaption: "Product" }],
        this.values= [{ fieldName: "Amount", fieldCaption: "Amount" }],
        this.filters= []
    }
}
Apply Filtering
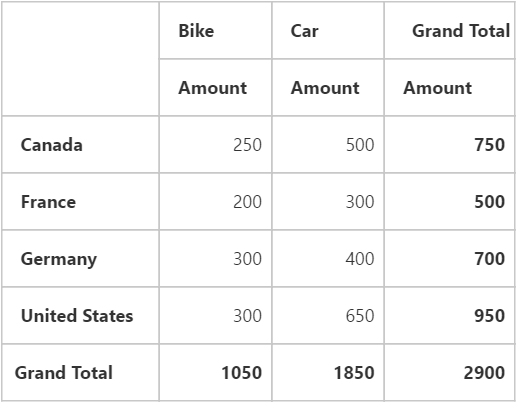
Filtering option allows you to specify a set of values that either need to be displayed or hidden. Also filtering option is applicable only for Row, Column and Filter areas.
“filterItems” object allow us to apply filtering to the fields using the following properties:
- filterType - indicates whether the values should be included or excluded.
- values - specify an array of values that needs to be included or excluded within the particular field.
//..

export class PivotGridComponent {
    public data; rows; columns;values;filters;
    constructor() {
        this.data = []; // data source
        this.rows= [{ fieldName: "Country",
                    fieldCaption: "Country",
                    filterItems: {
                        filterType: ej.PivotAnalysis.FilterType.Exclude,
                        values: ["United Kingdom"]
                    }
                }],
        this.columns= [{ fieldName: "Product",
                    fieldCaption: "Product",
                    filterItems: {
                        filterType: ej.PivotAnalysis.FilterType.Include,
                        values: ["Bike", "Car"]
                    }
                 }],
        this.values= [{ fieldName: "Amount", fieldCaption: "Amount" }],
        this.filters= []
    }
}
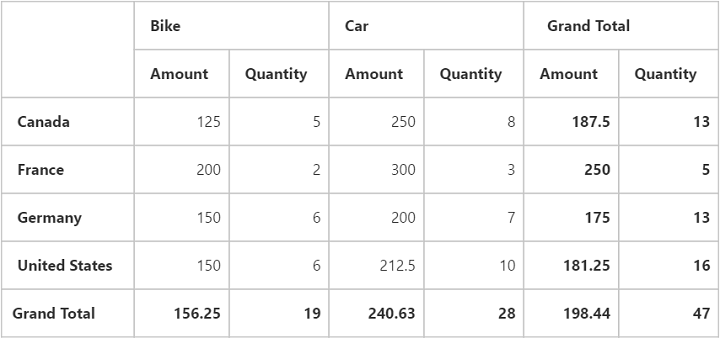
Apply Summary Types
Allow us to specify the required summary type that PivotGrid should use in its summary cells. “sum” is the default summary type. Following are the summary types that are supported:
- sum
- average
- count
- min
- max
//..
export class PivotGridComponent {
    public data; rows; columns;values;filters;
    constructor() {
        //..
        this.values= [{ fieldName: "Amount", fieldCaption: "Amount", summaryType: ej.PivotAnalysis.SummaryType.Average },
                    { fieldName: "Quantity", fieldCaption: "Quantity", summaryType: ej.PivotAnalysis.SummaryType.Sum }],
        this.filters= []
    }
}
OLAP
This section covers the information that you need to know to populate a simple PivotGrid with OLAP data source.
Control Initialization
Add necessary HTML elements in pivotgrid.component.html to render PivotGrid
<ej-pivotgrid dataSource.data="http://bi.syncfusion.com/olap/msmdpump.dll" dataSource.catalog="Adventure Works DW 2008 SE" dataSource.cube="Adventure Works" [dataSource.rows]="rows" [dataSource.columns]="columns" [dataSource.values]="values" [dataSource.filters]="filters">
</ej-pivotgrid>
Create a CSS page and add necessary CSS elements for PivotGrid
ej-pivotgrid {
        display: block;
        height: 450px;
        width: 100%;
        overflow: auto;
    }

    .e-pivotgrid{
        position: inherit !important;
    }
Populate PivotGrid with data
Let us now see how to populate the PivotGrid control using a sample JSON data as shown below.
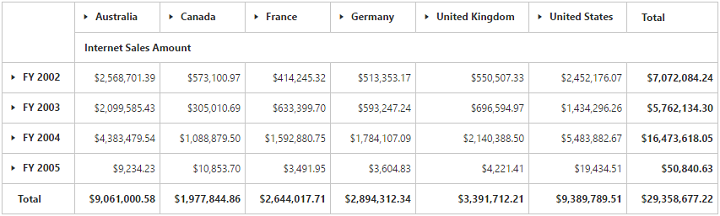
<ej-pivotgrid [enableToolTip]="false" dataSource.data="http://bi.syncfusion.com/olap/msmdpump.dll" dataSource.catalog="Adventure Works DW 2008 SE" dataSource.cube="Adventure Works" [dataSource.rows]="rows" [dataSource.columns]="columns" [dataSource.values]="values" [dataSource.filters]="filters">
</ej-pivotgrid>
//..
export class PivotGridComponent {
public rows; columns; values; filters;
constructor() {
this.rows = [{ fieldName: "[Date].[Fiscal]" }];
this.columns = [{ fieldName: "[Customer].[Customer Geography]" }];
this.values = [{ measures: [{ fieldName: "[Measures].[Internet Sales Amount]" }], axis: "columns" }];
this.filters = [];
}
}The above code will generate a simple PivotGrid with “Fiscal” field in Row, “Customer Geography” field in Column and “Internet Sales Amount” field in Value section.