Getting Started
28 Sep 201724 minutes to read
This section explains briefly about how to create a PivotGauge control in your application with Angular. This section covers only the minimal features that you need to know to get started with the PivotGauge.
Getting started with SystemJS
To quick start with Syncfusion JavaScript Angular components run the below commands to clone the repository for SystemJS starter and installing required dependency packages.
> git clone https://github.com/syncfusion/angular2-seeds/ -b systemjs

 > cd angular2-seeds

 > npm install
The below steps describes to add component with above cloned seed application.
Syncfusion JavaScript components source configuration and sample creation
- Copy required Syncfusion Angular source component(s) from the below build location and add it in
src/ejfolder (For ex., consider thepivotgaugecomponent).
(Installed Location)\Syncfusion\Essential Studio\28.1.33\JavaScript\assets-src\angular2\NOTE
core.tsfile is mandatory for all Syncfusion JavaScript Angular components. The repository having the source file from Essential Studio for JavaScript v28.1.33.
-
Create
pivotgaugefolder insidesrcfolder. -
Create
pivotgauge.component.htmlview file insidesrc/pivotgaugefolder and render ejPivotGauge Angular component using the below code example.
<ej-pivotgauge></ej-pivotgauge>- Create
pivotgauge.component.tsmodel file inside the foldersrc/pivotgaugeand create sample component using the below code example.
import { Component } from '@angular/core';

@Component({
  selector: 'ej-app',
  templateUrl: 'app/components/pivotgauge/pivotgauge.component.html',
  styleUrls: ['app/components/pivotgauge/pivotgauge.component.css'],
})

export class PivotGaugeComponent {
    //..
}
Configure the routes for the Router
Before adding router configuration for above created ejPivotGauge component, we recommend you to go through the Angular Routing configuration to get the deeper knowledge about Angular routing.
- Now, we are going to configure the route navigation link for created PivotGauge sample in
src/app.component.htmlfile.
<div>
	<ul class="nav navbar-nav">
		. . . .
		<li><a data-toggle="collapse" data-target="#skeleton-navigation-navbar-collapse.in" href="#pivotgauge" [routerLink]="['/pivotgauge']">PivotGauge </a></li>
	</ul>
</div>
<main>
	<router-outlet></router-outlet>
</main>- Import the ejPivotGauge sample component and define the route in
src/app.routes.tsfile.
import { Routes } from '@angular/router';
. . . .
import { PivotGaugeComponent } from './pivotgauge/pivotgauge.component';

export const rootRouterConfig: Routes = [
    { path: '', redirectTo: 'home', pathMatch: 'full' },
    . . . .
    { path: 'pivotgauge', component: PivotGaugeComponent }
];- Import and declare the Syncfusion source component and ejPivotGauge sample component into
app.module.tslike the below code snippet.
import { NgModule, enableProdMode, ErrorHandler } from '@angular/core';
. . . . .
import { EJ_PIVOTGAUGE_COMPONENTS } from './ej/pivotgauge.component';
import { PivotGaugeComponent } from './pivotgauge/pivotgauge.component';

import { rootRouterConfig } from './app.routes';
. . . .
@NgModule({
  imports: [BrowserModule, FormsModule, HttpModule, RouterModule.forRoot(rootRouterConfig, { useHash: true })],
  declarations: [. . . . , EJ_PIVOTGAUGE_COMPONENTS,PivotGaugeComponent],
  bootstrap: [AppComponent]
})
export class AppModule { }
Relational
This section covers the information that you need to know to populate a simple PivotGauge with Relational data source.
Control Initialization
Add necessary HTML elements in pivotgauge.component.html to render PivotGauge
<ej-pivotgauge [dataSource.data]="data" [dataSource.rows]="rows" [dataSource.columns]="columns" [dataSource.values]="values" [isResponsive]="true" [enableTooltip]="true" [backgroundColor]="transparent" [scales]="scales" >
</ej-pivotgauge>
Create a CSS page and add necessary CSS elements for PivotGauge
ej-pivotgauge{
    height: 340px;
    width: 100%;
    overflow: auto;
    float: left;
    position:relative
}
Populate PivotGauge with data
Let us now see how to populate the PivotGauge control using a sample JSON data as shown below.
<ej-pivotgauge [dataSource.data]="data" [dataSource.rows]="rows" [dataSource.columns]="columns" [dataSource.values]="values" [isResponsive]="true" [enableTooltip]="true" [backgroundColor]="transparent" [scales]="scales" >
</ej-pivotgauge>
//..
export class PivotGaugeComponent {
public data; rows; columns;values;
constructor() {
this.data = [
{ Amount: 100, Country: "Canada", Date: "FY 2005", Product: "Bike", Quantity: 2, State: "Alberta" },
{ Amount: 200, Country: "Canada", Date: "FY 2006", Product: "Van", Quantity: 3, State: "British Columbia" },
{ Amount: 300, Country: "Canada", Date: "FY 2007", Product: "Car", Quantity: 4, State: "Brunswick" },
{ Amount: 150, Country: "Canada", Date: "FY 2008", Product: "Bike", Quantity: 3, State: "Manitoba" },
{ Amount: 200, Country: "Canada", Date: "FY 2006", Product: "Car", Quantity: 4, State: "Ontario" },
{ Amount: 100, Country: "Canada", Date: "FY 2007", Product: "Van", Quantity: 1, State: "Quebec" },
{ Amount: 200, Country: "France", Date: "FY 2005", Product: "Bike", Quantity: 2, State: "Charente-Maritime" },
{ Amount: 250, Country: "France", Date: "FY 2006", Product: "Van", Quantity: 4, State: "Essonne" },
{ Amount: 300, Country: "France", Date: "FY 2007", Product: "Car", Quantity: 3, State: "Garonne (Haute)" },
{ Amount: 150, Country: "France", Date: "FY 2008", Product: "Van", Quantity: 2, State: "Gers" },
{ Amount: 200, Country: "Germany", Date: "FY 2006", Product: "Van", Quantity: 3, State: "Bayern" },
{ Amount: 250, Country: "Germany", Date: "FY 2007", Product: "Car", Quantity: 3, State: "Brandenburg" },
{ Amount: 150, Country: "Germany", Date: "FY 2008", Product: "Car", Quantity: 4, State: "Hamburg" },
{ Amount: 200, Country: "Germany", Date: "FY 2008", Product: "Bike", Quantity: 4, State: "Hessen" },
{ Amount: 150, Country: "Germany", Date: "FY 2007", Product: "Van", Quantity: 3, State: "Nordrhein-Westfalen" },
{ Amount: 100, Country: "Germany", Date: "FY 2005", Product: "Bike", Quantity: 2, State: "Saarland" },
{ Amount: 150, Country: "United Kingdom", Date: "FY 2008", Product: "Bike", Quantity: 5, State: "England" },
{ Amount: 250, Country: "United States", Date: "FY 2007", Product: "Car", Quantity: 4, State: "Alabama" },
{ Amount: 200, Country: "United States", Date: "FY 2005", Product: "Van", Quantity: 4, State: "California" },
{ Amount: 100, Country: "United States", Date: "FY 2006", Product: "Bike", Quantity: 2, State: "Colorado" },
{ Amount: 150, Country: "United States", Date: "FY 2008", Product: "Car", Quantity: 3, State: "New Mexico" },
{ Amount: 200, Country: "United States", Date: "FY 2005", Product: "Bike", Quantity: 4, State: "New York" },
{ Amount: 250, Country: "United States", Date: "FY 2008", Product: "Car", Quantity: 3, State: "North Carolina" },
{ Amount: 300, Country: "United States", Date: "FY 2007", Product: "Van", Quantity: 4, State: "South Carolina" }
];
this.rows = [{ fieldName: "Country", fieldCaption: "Country" }, { fieldName: "State", fieldCaption: "State" }];
this.columns = [{ fieldName: "Product", fieldCaption: "Product" }];
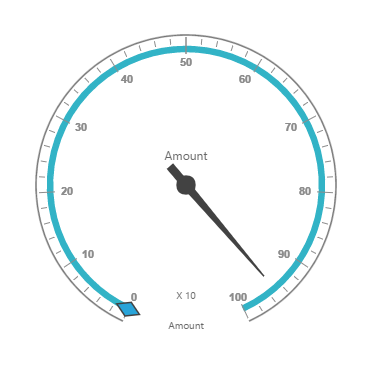
this.values = [{ fieldName: "Amount", fieldCaption: "Amount" }, { fieldName: "Quantity", fieldCaption: "Quantity" }];
this.scales = [{
showRanges: true,
radius: 150, showScaleBar: true, size: 1,
border: {
width: 0.5
},
showIndicators: true, showLabels: true,
pointers: [{
showBackNeedle: true,
backNeedleLength: 20,
length: 120,
width: 7
},
{
type: "marker",
markerType: "diamond",
distanceFromScale: 5,
placement: "center",
backgroundColor: "#29A4D9",
length: 25,
width: 15
}],
ticks: [{
type: "major",
distanceFromScale: 2,
height: 16,
width: 1, color: "#8c8c8c"
},
{
type: "minor",
height: 6,
width: 1,
distanceFromScale: 2,
color: "#8c8c8c"
}],
labels: [{
color: "#8c8c8c"
}],
ranges: [{
distanceFromScale: -5,
backgroundColor: "#fc0606",
border: { color: "#fc0606" }
}, {
distanceFromScale: -5
}],
customLabels: [{
position: { x: 180, y: 290 },
font: { size: "10px", fontFamily: "Segoe UI", fontStyle: "Normal" }, color: "#666666"
}, {
position: { x: 180, y: 320 },
font: { size: "10px", fontFamily: "Segoe UI", fontStyle: "Normal" }, color: "#666666"
}, {
position: { x: 180, y: 150 },
font: { size: "12px", fontFamily: "Segoe UI", fontStyle: "Normal" }, color: "#666666"
}]
}];
}
}The above code will generate a simple PivotGauge as shown in below figure.
OLAP
This section covers the information that you need to know to populate a simple PivotGauge with OLAP data source.
Control Initialization
Add necessary HTML elements in pivotgauge.component.html to render PivotGauge
<ej-pivotgauge [dataSource.data]="data" [dataSource.catalog]="catalog" [dataSource.cube]="cube" [dataSource.rows]="rows" [dataSource.columns]="columns" [dataSource.values]="values" [isResponsive]="true" [enableTooltip]="true" [backgroundColor]="transparent" [scales]="scales" >
</ej-pivotgauge>
Create a CSS page and add necessary CSS elements for PivotGauge
ej-pivotgauge{
    height: 340px;
    width: 100%;
    overflow: auto;
    float: left;
    position:relative
}
Populate PivotGauge with data
Let us now see how to populate the PivotGauge control using a sample JSON data as shown below.
<ej-pivotgauge dataSource.data="http://bi.syncfusion.com/olap/msmdpump.dll" dataSource.catalog="Adventure Works DW 2008 SE" dataSource.cube="Adventure Works" [dataSource.rows]="rows" [dataSource.columns]="columns" [dataSource.values]="values" [isResponsive]="true" [enableTooltip]="true" [backgroundColor]="transparent" [scales]="scales" >
</ej-pivotgauge>
//..
export class PivotGaugeComponent {
public rows; columns;values;scales;
constructor() {
this.rows = [{ fieldName: "[Date].[Fiscal]", filterItems: { filterType: "include", values: ["[Date].[Fiscal].[Fiscal Year].&[2004]"] } }];
this.columns = [{ fieldName: "[Customer].[Customer Geography]" }];
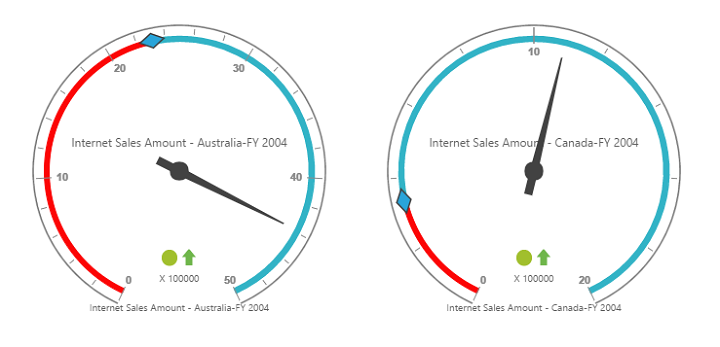
this.values = [{ measures: [{ fieldName: "[Measures].[Internet Sales Amount]", }, { fieldName: "[Measures].[Internet Revenue Status]" }, { fieldName: "[Measures].[Internet Revenue Trend]" }, { fieldName: "[Measures].[Internet Revenue Goal]" },], axis: "columns" }];
this.scales = [{
showRanges: true,
radius: 150, showScaleBar: true, size: 1,
border: {
width: 0.5
},
showIndicators: true, showLabels: true,
pointers: [{
showBackNeedle: true,
backNeedleLength: 20,
length: 120,
width: 7
},
{
type: "marker",
markerType: "diamond",
distanceFromScale: 5,
placement: "center",
backgroundColor: "#29A4D9",
length: 25,
width: 15
}],
ticks: [{
type: "major",
distanceFromScale: 2,
height: 16,
width: 1, color: "#8c8c8c"
},
{
type: "minor",
height: 6,
width: 1,
distanceFromScale: 2,
color: "#8c8c8c"
}],
labels: [{
color: "#8c8c8c"
}],
ranges: [{
distanceFromScale: -5,
backgroundColor: "#fc0606",
border: { color: "#fc0606" }
}, {
distanceFromScale: -5
}],
customLabels: [{
position: { x: 180, y: 290 },
font: { size: "10px", fontFamily: "Segoe UI", fontStyle: "Normal" }, color: "#666666"
}, {
position: { x: 180, y: 320 },
font: { size: "10px", fontFamily: "Segoe UI", fontStyle: "Normal" }, color: "#666666"
}, {
position: { x: 180, y: 150 },
font: { size: "12px", fontFamily: "Segoe UI", fontStyle: "Normal" }, color: "#666666"
}]
}];
}
}The above code will generate a simple PivotGauge as shown in below figure.