How can I help you?
Getting Started with Angular Maps
Before we start with the Maps, please refer this page for general information regarding integrating Syncfusion widget’s.
Adding JavaScript and CSS Reference
To render the Maps control, the following list of external dependencies are needed,
- jQuery - 1.7.1 and later versions
- jsRender - to render the templates
- Angular - Angular latest versions
The other required internal dependencies are tabulated below,
| Files | Description/Usage |
|---|---|
| ej.core.min.js | It is referred always before using all the JS controls. |
| ej.data.min.js | Used to handle data operation and is used while binding data to the JS controls. |
| ej.maps.min.js | Maps core script file which includes Maps related scripts files. |
NOTE
Maps uses one or more script files, therefore refer the
ej.web.all.min.js(which encapsulates all theejcontrols and frameworks in a single file) in the application instead of referring all the above specified internal dependencies.
To get the real appearance of the Maps, the dependent CSS file ej.web.all.min.css (which includes styles of all the widgets) should also needs to be referred.
Preparing HTML document
Create an HTML page and add the scripts references in the order mentioned in the following code example.
<html>
    <head>
    <title>Angular Maps</title>

    <!-- Essential Studio for JavaScript  theme reference -->
    <link rel="stylesheet" href="http://cdn.syncfusion.com/32.2.3/js/web/flat-azure/ej.web.all.min.css" />

    <!-- Angular related script references -->
    <!-- 1. Load libraries -->
         <!-- Polyfill(s) for older browsers -->
    <script src="node_modules/core-js/client/shim.min.js"></script>
    <script src="node_modules/zone.js/dist/zone.js"></script>
    <script src="node_modules/reflect-metadata/Reflect.js"></script>
    <script src="node_modules/systemjs/dist/system.src.js"></script>

    <!-- Essential Studio for JavaScript  script references -->
    <script src="https://code.jquery.com/jquery-1.10.2.min.js"></script>
    <script src="http://cdn.syncfusion.com/32.2.3/js/web/ej.web.all.min.js"> </script>
    <script src="http://cdn.syncfusion.com/32.2.3/js/common/ej.angular2.min.js"></script>

    <!-- 2. Configure SystemJS -->
    <script src="systemjs.config.js"></script>
    <script>
      System.import('app')
            .then(null, console.error.bind(console));
    </script>

    </head>
    <!-- 3. Display the application -->
    <body>
    <ej-app>
		    <div class="splash">
			      <div class="message">Angular Syncfusion Components App</div>
			      <div class="spinner"></div>
		    </div>
	  </ej-app>
    </body>
    </html>
NOTE
Uncompressed version of library files are also available which is used for development or debugging purpose and can be generated from the custom script here.
Control Initialization
- Copy Maps Syncfusion Angular source component(s) from the below build location and add it in
src/ejfolder (For ex., consider themapscomponent).
(Installed Location)\Syncfusion\Essential Studio\14.3.0.49\JavaScript\assets-src\angular2\NOTE
core.tsfile is mandatory for all Syncfusion JavaScript Angular components. The repository having the source file from Essential Studio for JavaScript v14.3.0.49.
-
Create
mapsfolder insidesrcfolder. -
Create
maps.component.htmlview file insidesrc/mapsfolder and render ejMaps Angular component using the below code example.
<ej-maps id="defaultmaps" layerType="bing">
</ej-maps>- Create
maps.component.tsmodel file inside the foldersrc/mapsand create sample component using the below code example.
import { Component, ViewEncapsulation } from '@angular/core';

@Component({
  selector: 'ej-app',
  templateUrl: 'src/maps/maps.component.html'
})
export class MapsComponent {

}
Configure the routes for the Router
Before adding router configuration for above created ejMaps component, we recommend you to go through the Angular Routing configuration to get the deeper knowledge about Angular routing.
- Now, we are going to configure the route navigation link for created maps sample in
src/app.component.htmlfile.
<div>
	<ul class="nav navbar-nav">
		<li>
          <a data-toggle="collapse" data-target="#skeleton-navigation-navbar-collapse.in" href="#maps" [routerLink]="['/maps']">maps </a>
        </li>
	</ul>
</div>
<main>
	<router-outlet></router-outlet>
</main>- Import the ejMaps sample component and define the route in
src/app.routes.tsfile.
import { Routes } from '@angular/router';
. . . .
import { MapsComponent } from './maps/maps.component';

export const rootRouterConfig: Routes = [
    { path: '', redirectTo: 'home', pathMatch: 'full' },
    . . . .
    { path: 'maps', component: MapsComponent }
];- Import and declare the Syncfusion source component and ejMaps sample component into
app.module.tslike the below code snippet.
import { NgModule, enableProdMode, ErrorHandler } from '@angular/core';
. . . . .
import { EJ_MAPS_COMPONENTS } from './ej/maps.component';
import { MapsComponent } from './maps/maps.component';

import { rootRouterConfig } from './app.routes';
. . . .
@NgModule({
  imports: [BrowserModule, FormsModule, HttpModule, RouterModule.forRoot(rootRouterConfig, { useHash: true })],
  declarations: [. . . . , EJ_MAPS_COMPONENTS, MapsComponent],
  bootstrap: [AppComponent]
})
export class AppModule { }
Running the application
- To run the application, execute below command.
npm start- The component is rendered as like the below screenshot. You can make changes in the code found under src folder and the browser should auto-refresh itself while you save files.

Prepare Shape Data
The Shape Data collection describing geographical shape information can be obtained from GEOJSON format shapes.
In this example, USA shape is used as shape data by utilizing the “United States of America.json” file in the following folder structure obtained from downloaded Maps_GeoJSON folder.
..\ Maps_GeoJSON\All Countries with States
You can assign the complete contents in “United States of America.json” file to new JSON object. For your better understanding, a JS file “usa.js” is already created to store JSON data in JSON object “usMap”.
Prepare DataSource
The datasource is populated with JSON data relative to shape data and stored in JSON object. USA population as datasource is used for better understanding. The “populationData.js” file is used to store JSON data in JSON object “populationData”.
import { Component, ViewEncapsulation} from '@angular/core';
import { DataService} from '../service/data.service';

@Component({
selector:"ej-app",
templateUrl:"src/maps/maps.component.html",
providers:[DataService]
})
export class MapsComponent{
usMap: any;
dataSource: any;
colorMapping: any;
    constructor(dataService:DataService){
        this.usMap=dataService.mapsData();
        this.dataSource=dataService.populationData();
    }
}
Create a folder service and add file data.service.ts for serving data to map component file. Refer the below code snippet.
export class DataService{
// Shape data method
    mapsData():any{
        return{
        //Paste all the content copied from the usa.js file//
        }
    }
// Data source method
 populationData():Array<any> {
        return[
        { name: 'California', population: '38332521' },
        { name: 'Texas', population: '26448193' },
        { name: 'New York', population: '19651127' },
        { name: 'Florida', population: '19552860' },
        { name: 'Illinois', population: '12882135' },
        { name: 'Pennsylvania', population: '12773801' },
        { name: 'Ohio', population: '11570808' },
        { name: 'Georgia', population: '9992167' },
        { name: 'Michigan', population: '9895622' },
        { name: 'North Carolina', population: '9848060' },
        { name: 'New Jersey', population: '8899339' },
        { name: 'Virginia', population: '8260405' },
        { name: 'Washington', population: '6971406' },
        { name: 'Massachusetts', population: '6692824' },
        { name: 'Arizona', population: '6626624' },
        { name: 'Indiana', population: '6570902' },
        { name: 'Tennessee', population: '6495978' },
        { name: 'Missouri', population: '6044171' },
        { name: 'Maryland', population: '5928814' },
        { name: 'Wisconsin', population: '5742713' },
        { name: 'Minnesota', population: '5420380' },
        { name: 'Colorado', population: '5268367' },
        { name: 'Alabama', population: '4833722' },
        { name: 'South Carolina', population: '4774839' },
        { name: 'Louisiana', population: '4625470' },
        { name: 'Kentucky', population: '4395295' },
        { name: 'Oregon', population: '3930065' },
        { name: 'Oklahoma', population: '3850568' },
        { name: 'Puerto Rico', population: '3615086' },
        { name: 'Connecticut', population: '3596080' },
        { name: 'Iowa', population: '3090416' },
        { name: 'Mississippi', population: '2991207' },
        { name: 'Arkansas', population: '2959373' },
        { name: 'Utah', population: '2900872' },
        { name: 'Kansas', population: '2893957' },
        { name: 'Nevada', population: '2790136' },
        { name: 'New Mexico', population: '2085287' },
        { name: 'Nebraska', population: '1868516' },
        { name: 'West Virginia', population: '1854304' },
        { name: 'Idaho', population: '1612136' },
        { name: 'Hawaii', population: '1404054' },
        { name: 'Maine', population: '1328302' },
        { name: 'New Hampshire', population: '1323459' },
        { name: 'Rhode Island', population: '1051511' },
        { name: 'Montana', population: '1015165' },
        { name: 'Delaware', population: '925749' },
        { name: 'South Dakota', population: '844877' },
        { name: 'Alaska', population: '735132' },
        { name: 'North Dakota', population: '723393' },
        { name: 'District of Columbia', population: '646449' },
        { name: 'Vermont', population: '626630' },
        { name: 'Wyoming', population: '582658' }
       ];
    }
}
Initialize Map
1. Create a <div> tag with a specific id and set the height and width to determine the rendering map’s size with ej-map attribute.
2. Create a e-layers with parent of e-layers inside the mapContainer tag ej-map.
3. Set the shapeData attribute value as usMap which contains the USA shape data details.
<ej-map id="container" style="height:400px;width:600px;">
    <e-layers>
        <e-layer [shapeData]="usmap"></e-layer>
    </e-layers>
</ej-map>
2. Add a script tag anywhere in the web page and add the following code.
import { Component} from '@angular/core';
import { DataService} from '../service/data.service';

@Component({
selector:"ej-app",
templateUrl:"src/maps/maps.component.html",
providers:[DataService]
})
export class MapsComponent{
usMap: any;
    constructor(dataService:DataService){
        this.usMap=dataService.mapsData();
    }
}
The above code renders a map, with default properties and shape input provided through data in layers.
Data Binding in Map
The following properties in shape layers are used for binding data in Map control.
- dataSource
- shapeDataPath
- shapePropertyPath
DataSource
The dataSource property accepts collection values as input. For example, the list of objects can be provided as input.
Shape Data Path
The shapeDataPath property used to refer the data ID in dataSource. For example, “populationData” JSON object contains data ids ‘name’ and ‘population’. The shapeDataPath and the shapePropertyPath properties are related to each other (refer to shapePropertyPath for more details).
Shape Property Path
The shapePropertyPath property is similar to the shapeDataPath that refers the column name in the shapeData property of shape layers to identify the shape. When the values of the shapeDataPath property in the dataSource property and the value of shapePropertyPath in the shapeData property match, then the associated object from the dataSource is bound to the corresponding shape.
The JSON object “populationData” is used as dataSource in the following code example.
<ej-map id="container" style="height:400px;width:600px;">
    <e-layers>
        <e-layer [shapeData]="usmap" [dataSource]="dataSource" shapeDataPath="name"
                                         shapePropertyPath="name">
        </e-layer>
    </e-layers>
</ej-map>
Customize Map Appearance
You can customize the shape’s color by using fill, stroke and strokeThickness properties in shapeSettings.
<ej-map id="container" style="height:400px;width:600px;">
    <e-layers>
        <e-layer enableSelection="false" enableMouseHover="true"
         shapeSettings.strokeThickness="0.5" shapeSettings.fill="#9CBF4E"
         shapeSettings.highlightStroke="White" shapeSettings.highlightColor="#BC5353"
         shapeSettings.highlightBorderWidth="1"  shapeSettings.stroke="White">
        </e-layer>
    </e-layers>
</ej-map>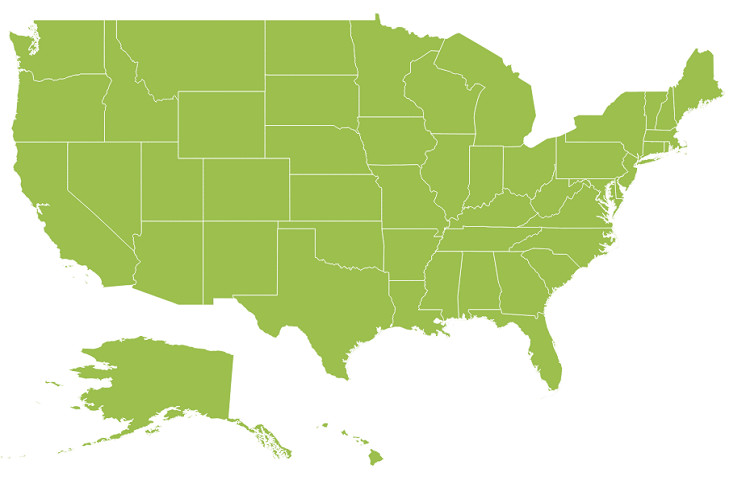
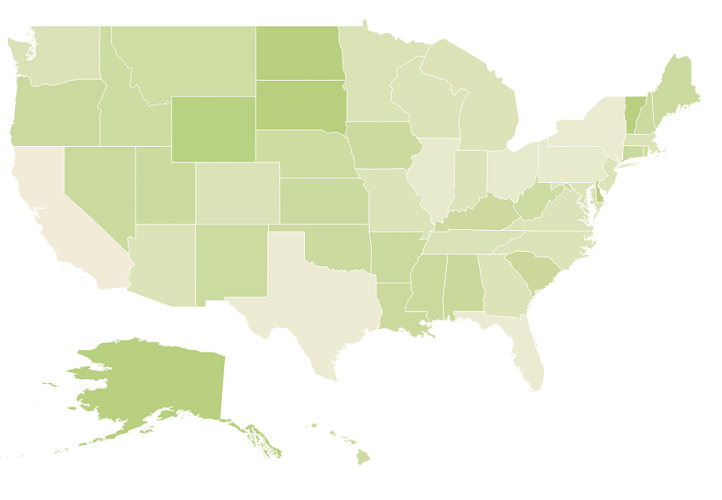
Customize Map Appearance by Range
The Range color mapping is used to differentiate the shape’s fill based on its underlying value and color ranges. The from and to properties defines the value ranges and the gradientColors property defines the equivalent color ranges respective to their value ranges.
NOTE
The
enableGradientproperty value is set to true to apply gradient colors for the maps.
<div  style="height:400px;width:600px;">
<ej-map id="container">
    <e-layers>
        <e-layer shapeSettings.valuePath="name" [shapeSettings.enableGradient]="true"
                 shapeSettings.colorValuePath="population"
                 [shapeSettings.colorMappings.rangeColorMapping]="colorMapping">
        </e-layer>
    </e-layers>
</ej-map>
</div>import { Component, ViewEncapsulation} from '@angular/core';
import { DataService} from '../service/data.service';
@Component({
selector:"ej-app",
templateUrl:"src/maps/maps.component.html",
providers:[DataService]
})
export class MapsComponent{
colorMapping: any;
constructor(dataService:DataService){
this.colorMapping=
[
{
from:500000, to:1000000, gradientColors:["#9CBF4E", "#B8CE7B"]
},
{
from:1000001, to:5000000, gradientColors:["#B8CE7B", "#CBD89A"]
},
{
from:5000001, to:10000000, gradientColors:["#CBD89A", "#DEE2B9"]
},
{
from:10000001, to:40000000, gradientColors:["#DEE2B9", "#F1ECD8"]
}
];
}
}The following screenshot illustrates a map with gradient color property enabled.
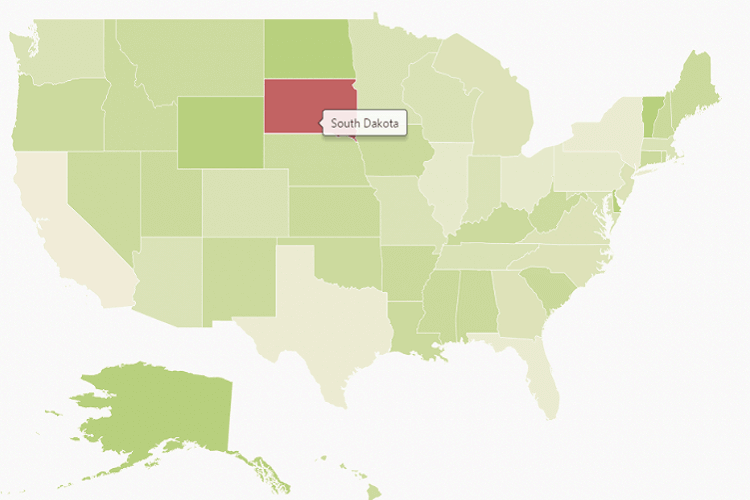
Enable Tooltip
The tooltip is displayed only when the showTooltip is set to “true” in the layers. By default, it takes the property of the bound object that is referred in the valuePath and displays its content on hovering the corresponding shape. The tooltipTemplate property is used for customizing the template for tooltip.
<div  style="height:400px;width:600px;">
<ej-map id="container">
    <e-layers>
        <e-layer [showTooltip]="true">
        </e-layer>
    </e-layers>
</ej-map>
</div>
The following screenshot illustrates a map control displaying a Tooltip.
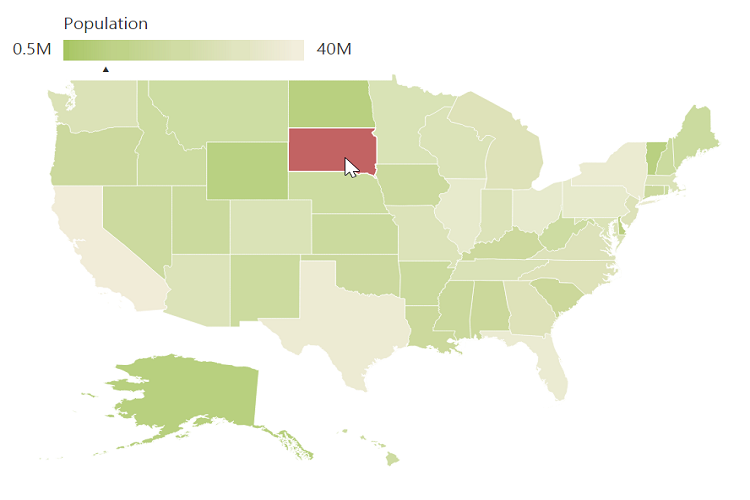
Legend
A Legend can be made visible by setting the showLegend property in legendSettings.
Interactive Legend
The legends can be made interactive with an arrow mark indicating the exact range color in the legend, when the mouse hovers on the corresponding shape. You can enable this option by setting the mode property in the legendSettings value as “interactive”. The default value of mode property is “default” to enable the normal legend.
Title
Use the title property to provide title for interactive legend.
Label
You can use leftLabel and rightLabel property to provide left and right labels for interactive legend.
<div  style="height:400px;width:600px;">
<ej-map id="container">
    <e-layers>
        <e-layer
         [legendSettings.showLegend]="true" [legendSettings.dockOnMap]="true"
         [legendSettings.height]="18" [legendSettings.width]="190"
         legendSettings.mode="interactive"
         legendSettings.title="Population"
         legendSettings.leftLabel='0.5M'
         legendSettings.rightLabel='40M'>
        </e-layer>
    </e-layers>
</ej-map>
</div>
The following screenshot illustrates a map displaying an interactive legend.