Getting Started
5 Jan 201823 minutes to read
Before we start with the BulletGraph, please refer this page for general information regarding integrating Syncfusion widget’s.
Adding JavaScript and CSS Reference
To render the BulletGraph control, the following list of external dependencies are needed,
- jQuery - 1.7.1 and later versions
- jsRender - to render the templates
- Angular - Angular latest versions
The other required internal dependencies are tabulated below,
| Files | Description/Usage |
|---|---|
| ej.core.min.js | It is referred always before using all the JS controls. |
| ej.data.min.js | Used to handle data operation and is used while binding data to the JS controls. |
| ej.bulletgraph.min.js | BulletGraph core script file which includes BulletGraph related scripts files. |
Preparing HTML document
Create an HTML page and add the scripts references in the order mentioned in the following code example.
<html>
    <head>
    <title>Angular BulletGraph</title>

    <!-- Essential Studio for JavaScript  theme reference -->
    <link rel="stylesheet" href="http://cdn.syncfusion.com/28.1.33/js/web/flat-azure/ej.web.all.min.css" />

    <!-- Angular related script references -->
    <!-- 1. Load libraries -->
         <!-- Polyfill(s) for older browsers -->
    <script src="node_modules/core-js/client/shim.min.js"></script>
    <script src="node_modules/zone.js/dist/zone.js"></script>
    <script src="node_modules/reflect-metadata/Reflect.js"></script>
    <script src="node_modules/systemjs/dist/system.src.js"></script>

    <!-- Essential Studio for JavaScript  script references -->
    <script src="https://code.jquery.com/jquery-1.10.2.min.js"></script>
    <script src="http://cdn.syncfusion.com/28.1.33/js/web/ej.web.all.min.js"> </script>
    <script src="http://cdn.syncfusion.com/28.1.33/js/common/ej.angular2.min.js"></script>

    <!-- 2. Configure SystemJS -->
    <script src="systemjs.config.js"></script>
    <script>
      System.import('app').then(null, console.error.bind(console));
    </script>

    </head>
    <!-- 3. Display the application -->
    <body>
       <ej-app>
		<div class="splash">
		    <div class="message">Angular Syncfusion Components App</div>
		    <div class="spinner"></div>
		 </div>
	   </ej-app>
    </body>
    </html>
NOTE
Uncompressed version of library files are also available which is used for development or debugging purpose and can be generated from the custom script here.
Control Initialization
- Copy BulletGraph Syncfusion Angular source component(s) from the below build location and add it in
src/ejfolder (For ex., consider theBulletGraphcomponent).
(Installed Location)\Syncfusion\Essential Studio\14.3.0.49\JavaScript\assets-src\angular2\NOTE
core.tsfile is mandatory for all Syncfusion JavaScript Angular components. The repository having the source file from Essential Studio for JavaScript v14.3.0.49.
-
Create
BulletGraphfolder insidesrcfolder. -
Create
BulletGraph.component.htmlview file insidesrc/BulletGraphfolder and render ejBulletGraph Angular component using the below code example.
<ej-bulletgraph id="defaultbulletgraph">
</ej-bulletgraph>- Create
BulletGraph.component.tsmodel file inside the foldersrc/BulletGraphand create sample component using the below code example.
import { Component, ViewEncapsulation } from '@angular/core';

@Component({
  selector: 'ej-app',
  templateUrl: 'src/BulletGraph/BulletGraph.component.html'
})
export class BulletgraphComponent {

}
Configure the routes for the Router
Before adding router configuration for above created ejBulletGraph component, we recommend you to go through the Angular Routing configuration to get the deeper knowledge about Angular routing.
- Now, we are going to configure the route navigation link for created bullet graph sample in
src/app.component.htmlfile.
<div>
	<ul class="nav navbar-nav">
		<li>
		    <a data-toggle="collapse" data-target="#skeleton-navigation-navbar-collapse.in"
		       href="#BulletGraph" [routerLink]="['/BulletGraph']">BulletGraph </a>
		</li>
	</ul>
</div>
<main>
	<router-outlet></router-outlet>
</main>- Import the ejBulletGraph sample component and define the route in
src/app.routes.tsfile.
import { Routes } from '@angular/router';
. . . .
import { BulletGraphComponent } from './BulletGraph/BulletGraph.component';

export const rootRouterConfig: Routes = [
    { path: '', redirectTo: 'home', pathMatch: 'full' },
    . . . .
    { path: 'BulletGraph', component: BulletGraphComponent }
];- Import and declare the Syncfusion source component and ejBulletGraph sample component into
app.module.tslike the below code snippet.
import { NgModule, enableProdMode, ErrorHandler } from '@angular/core';
. . . . .
import { EJ_BULLETGRAPH_COMPONENTS } from './ej/BulletGraph.component';
import { BulletGraphComponent } from './BulletGraph/BulletGraph.component';

import { rootRouterConfig } from './app.routes';
. . . .
@NgModule({
  imports: [BrowserModule, FormsModule, HttpModule, RouterModule.forRoot(rootRouterConfig, { useHash: true })],
  declarations: [. . . . , EJ_BULLETGRAPH_COMPONENTS, BulletgraphComponent],
  bootstrap: [AppComponent]
})
export class AppModule { }
Running the application
- To run the application, execute below command.
npm start- Browse to http://localhost:3000 to see the application. And navigate to bullet graph tab. The component is rendered as like the below screenshot. You can make changes in the code found under src folder and the browser should auto-refresh itself while you save files.
##Provide Required Data
You can customize the values of feature and comparative measure bars in a BulletGraph, either locally or remotely. The category data is optional, and is used to display label values in parallel to the measure bars.
Assign the data in fieldData property to the dataSource property of BulletGraph as shown in the following code example.
<div id="frame">
    <ej-bulletgraph id="bulletgraph"  [fields.dataSource]="fieldData">
    </ej-bulletgraph>
</div>import {Component} from '@angular/core';
import { DataService} from '../service/data.service'
@Component({
selector:'ej-app',
templateUrl:'src/BulletGraph/BulletGraph.component.html',
providers:[DataService]
})
export class BulletgraphComponent{
fieldData:Object;
constructor(dataService:DataService){
this.fieldData= dataService.bulletGraphData()
}
}Create a folder service and add file data.service.ts for serving data to bullet graph component file. Refer the below code snippet.
export class DataService{
bulletGraphData():Array<any>{
        return[
               {
                   value: 90, comparativeMeasureValue: 100,
                   category: 2013
               },
               {
                   value: 93, comparativeMeasureValue: 99,
                   category: 2012
               },
               {
                   value: 98, comparativeMeasureValue: 96,
                   category: 2011
               },
               {
                   value: 102, comparativeMeasureValue: 98,
                   category: 2010
               },
               {
                   value: 77, comparativeMeasureValue: 96,
                   category: 2009
               },
               {
                   value: 99, comparativeMeasureValue: 99,
                   category: 2008
               },
               {
                   value: 106, comparativeMeasureValue: 94,
                   category: 2007
               },
               {
                   value: 105, comparativeMeasureValue: 95,
                   category: 2006
               },
               {
                   value: 98, comparativeMeasureValue: 98,
                   category: 2005
               },
               {
                   value: 87, comparativeMeasureValue: 100,
                   category: 2004
               },
               {
                   value: 105, comparativeMeasureValue: 98,
                   category: 2003
               },
               {
                   value: 84, comparativeMeasureValue: 101,
                   category: 2002
               },
               {
                   value: 93, comparativeMeasureValue: 98,
                   category: 2001
               },
               {
                   value: 90, comparativeMeasureValue: 96,
                   category: 2000
               },
               {
                   value: 95, comparativeMeasureValue: 107,
                   category: 1999
               },
               {
                   value: 104, comparativeMeasureValue: 98,
                   category: 1998
               },
               {
                   value: 102, comparativeMeasureValue: 92,
                   category: 1997
               },
               {
                   value: 103, comparativeMeasureValue: 98,
                   category: 1996
               },
               {
                   value: 100, comparativeMeasureValue: 96,
                   category: 1995
               },
               {
                   value: 110, comparativeMeasureValue: 92,
                   category: 1994
               },
               {
                   value: 100, comparativeMeasureValue: 103,
                   category: 1993
               },
               {
                   value: 94, comparativeMeasureValue: 93,
                   category: 1992
               },
               {
                   value: 91, comparativeMeasureValue: 95,
                   category: 1991
               },
               {
                   value: 107, comparativeMeasureValue: 103,
                   category: 1990
               },
               {
                   value: 101, comparativeMeasureValue: 102,
                   category: 1989
               },
               {
                   value: 119, comparativeMeasureValue: 112,
                   category: 1988
               }
        ];
    }
}
Once the dataSource property is assigned with the required values, you can bind the variable names used in the JSON data to the corresponding fields of the BulletGraph as shown in the following code sample.
<ej-bulletgraph id="bulletgraph"  [fields.dataSource]="fieldData" fields.category="category"
        fields.featureMeasures="value" fields.comparativeMeasure="comparativeMeasureValue">
</ej-bulletgraph>
Set Default and Scale Values
You can plot more number of measure bars within the BulletGraph, the height and width of the control should be increased to locate all the measure bars within the graph.The qualitativeRangeSize and quantitativeScaleLength property needs to be set accordingly as shown in the following code example.
By default, the BulletGraph is rendered in the Horizontal orientation with its flow direction set to Forward.
Minimum, maximum and interval values for the quantitativeScale of the bullet graph should be set, as shown in the following code example.
<ej-bulletgraph id="bulletgraph"
    [height]="540" [width]="850"
    [qualitativeRangeSize]="700" [quantitativeScaleLength]="420"
    orientation="vertical" flowDirection="backward" [quantitativeScaleSettings.interval]="10"
    [quantitativeScaleSettings.minimum]="70" [quantitativeScaleSettings.maximum]="130"
    quantitativeScaleSettings.tickPosition="far"
    [fields.dataSource]="fieldData" fields.category="category"
    fields.featureMeasures="value" fields.comparativeMeasure="comparativeMeasureValue">
</ej-bulletgraph>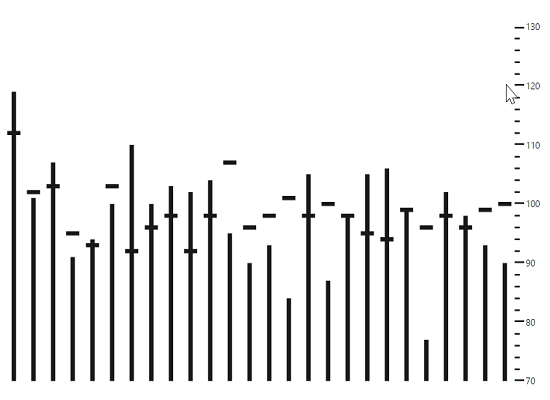
As you can see in the image above, the bullet graph without any ranges is displayed in the background. The steps to add the qualitativeRanges are described in the next section.
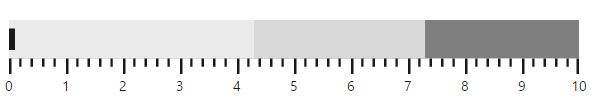
Add Qualitative Ranges
By default, 3 ranges are displayed in the BulletGraph control during the initial rendering of the control with its default values. In order to customize it, you need to set appropriate values for the rangeEnd and its rangeStroke properties. Any number of qualitativeRanges can be added to the control.
<ej-bulletgraph>
     <e-qualitativeranges>
         <e-qualitativerange rangeEnd="90">
         </e-qualitativerange>
         <e-qualitativerange rangeEnd="110">
         </e-qualitativerange>
         <e-qualitativerange rangeEnd="130" rangeStroke="#CDC9C9">
         </e-qualitativerange>
     </e-qualitativeranges>
</ej-bulletgraph>
After adding qualitativeRanges to the BulletGraph, the control will be rendered as follows.
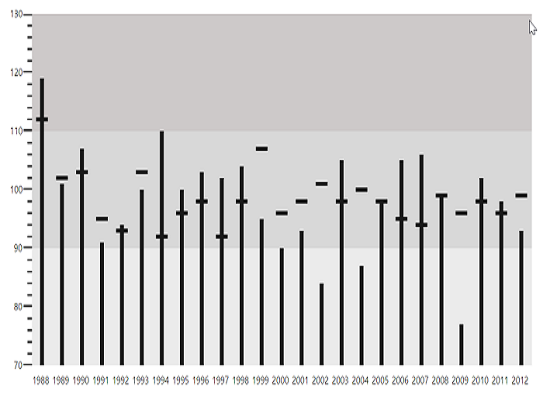
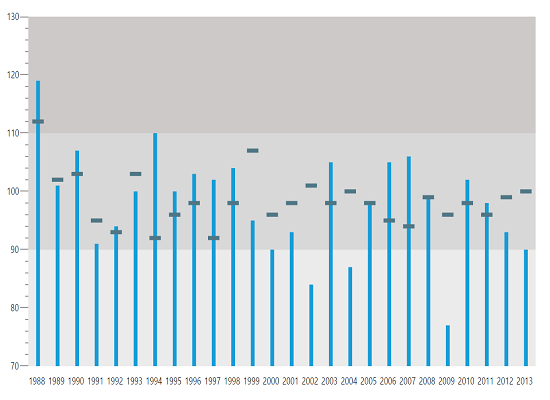
Ticks and Measure Bars Customization
You have to do the following code changes in the quantitative scale in order to customize the tick size, the colors of the feature bar and comparative measure symbols.
<ej-bulletgraph [quantitativeScaleSettings.majorTickSettings.width]="1"
        [quantitativeScaleSettings.majorTickSettings.size]="13"
        quantitativeScaleSettings.majorTickSettings.stroke="gray"
        [quantitativeScaleSettings.minorTickSettings.width]="1"
        [quantitativeScaleSettings.minorTickSettings.size]="5"
        quantitativeScaleSettings.minorTickSettings.stroke="gray"
        quantitativeScaleSettings.comparativeMeasureSettings.stroke="#507786"
        quantitativeScaleSettings.featuredMeasureSettings.stroke="#169DD8">
</ej-bulletgraph>
When customization of ticks and measure bars is done, BulletGraph looks as follows
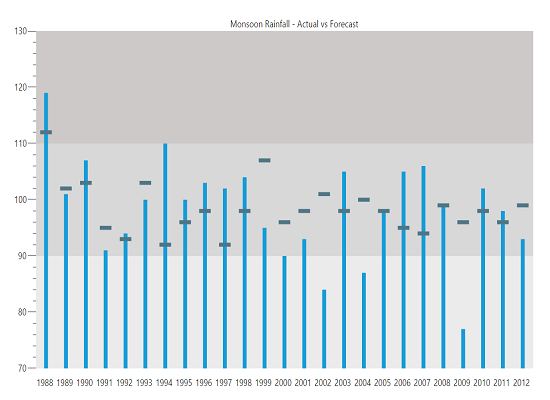
Add Caption
You can display an appropriate Caption in the BulletGraph by adding the following code example.
<ej-bulletgraph  captionSettings.textPosition='top' captionSettings.textAlignment='center'
  captionSettings.textAnchor='middle'captionSettings.text="Monsoon Rainfall - Actual vs Forecast"
   captionSettings.font.fontFamily="segoe ui" captionSettings.font.fontStyle="normal"
   captionSettings.font.size="12px" captionSettings.font.fontWeight="regular"
 [captionSettings.font.opacity]="1">
</ej-bulletgraph>
The following screenshot displays a BulletGraph in the caption and title in the BulletGraph.
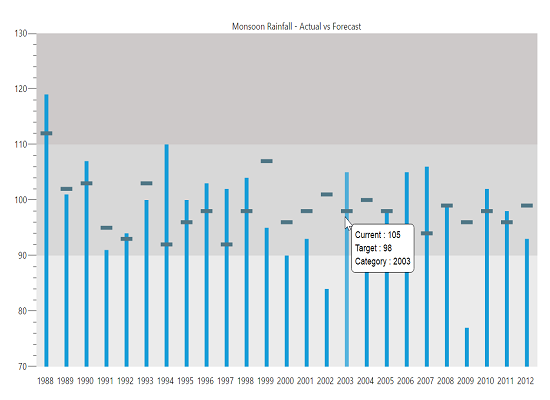
Show Tooltip
You can use a Tooltip in your application to display any information. The tooltip is enabled by setting the visible property in tooltip to true.
<ej-bulletgraph  [tooltipSettings.visible]="true">
</ej-bulletgraph>
By using the customization options discussed in this section, the BulletGraph is rendered as displayed on the following screenshot.