Appearance in Angular Chart
28 Oct 20227 minutes to read
Custom Color Palette
The Chart displays different series in different colors by default. You can customize the color of each series by providing a custom color palette of your choice by using the [palette] property.
<ej-chart id="chartcontainer" [palette]="[ 'yellow', 'skyblue', 'orange',
                                 'yellow', 'cyan', 'lightBlue', '#ff0ade']" >

   </ej-chart>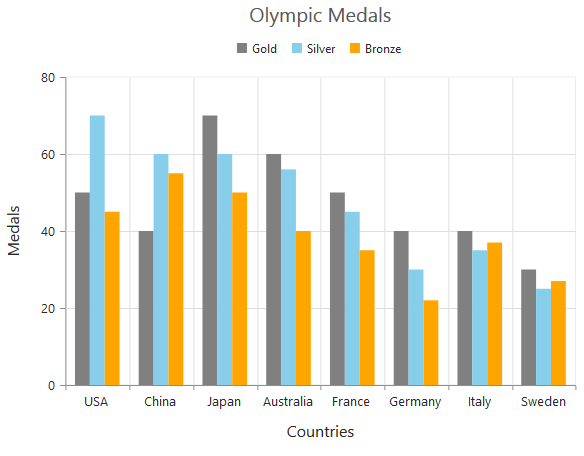
NOTE
The Color palette is applied to the points in accumulation type series
Built-in Themes
Following are the built-in themes available in the Chart
- flatLight
- flatDark
- gradientLight
- gradientDark
- azure
- azureDark
- lime
- limeDark
- saffron
- saffronDark
- gradient-azure
- gradient-azureDark
- gradient-lime
- gradient-limeDark
- gradient-saffron
- gradient-saffronDark
You can set your desired theme by using the theme property. Flat light is the default theme used in the Chart.
<ej-chart id="chartcontainer" theme="gradientlight">

   </ej-chart>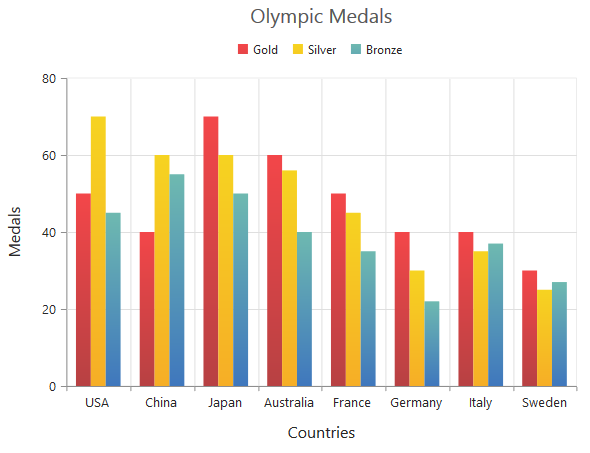
Point level customization
Marker, data label and fill color of each point in a series can be customized individually by using the points collection.
<ej-chart id="chartcontainer">
    <e-seriescollection>
        <e-series>
		 <e-points>
		   <e-point x="10" [y]="50" fill="#E27F2D" [marker.visible]="true">
           </e-point>
         </e-points>
		</e-series>
    </e-seriescollection>
</ej-chart>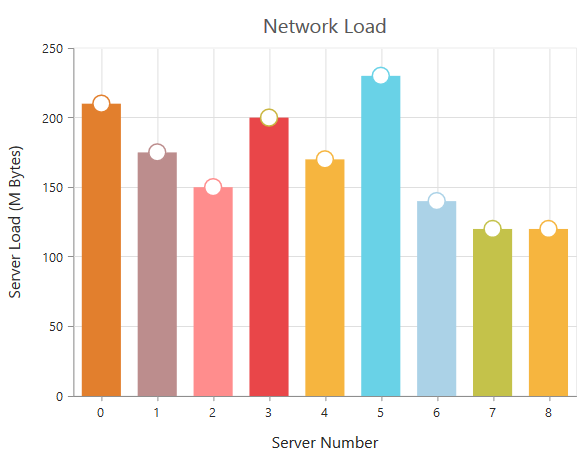
Series border customization
To customize the series border color, width and dashArray, you can use series.border option.
NOTE
Series border can be applied to all the series (except Line, Spline, HiLo, HiLoOpenClose and StepLine series).
<ej-chart id="chartcontainer">
    <e-seriescollection>
        <e-series>
		 <e-points>
		   <e-point x="20" [y]="80"  border.color="blue" [border.width]= 2
                                                  border.dashArray= "5,3" >
           </e-point>
         </e-points>
		</e-series>
    </e-seriescollection>

</ej-chart>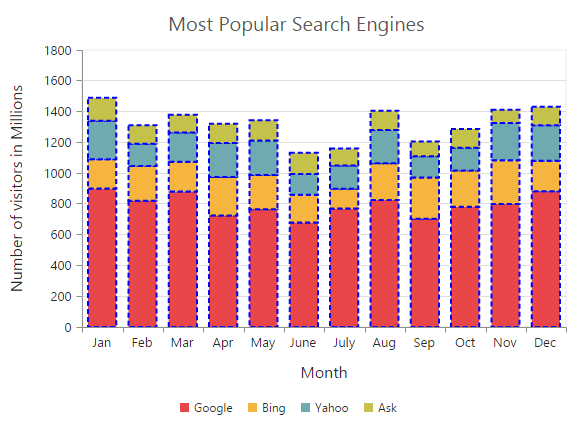
Chart area customization
Customize chart background
The Chart background can be customized by using the background property of the Chart. To customize the chart border, use border option of the chart.
<ej-chart id="chartcontainer"  background="skyblue"  [border.width]="2"
                                               [border.opacity]="0.35" >

</ej-chart>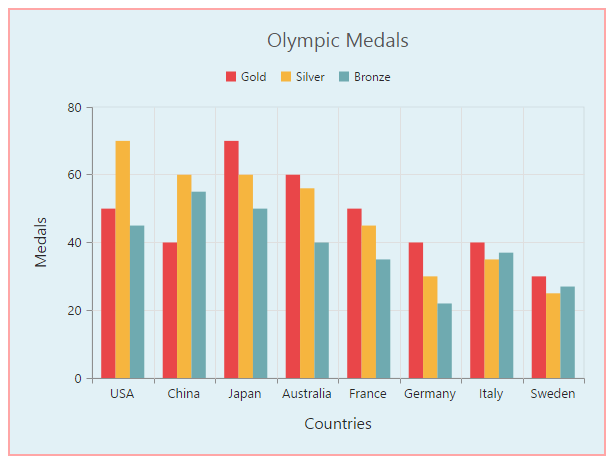
Chart Margin
The Chart [margin] property is used to add the margin to the chart area at the left, right, top and bottom position.
<ej-chart id="chartcontainer"  margin.left="80" margin.right="80" margin.top="40"
                                                             margin.bottom="80">

</ej-chart>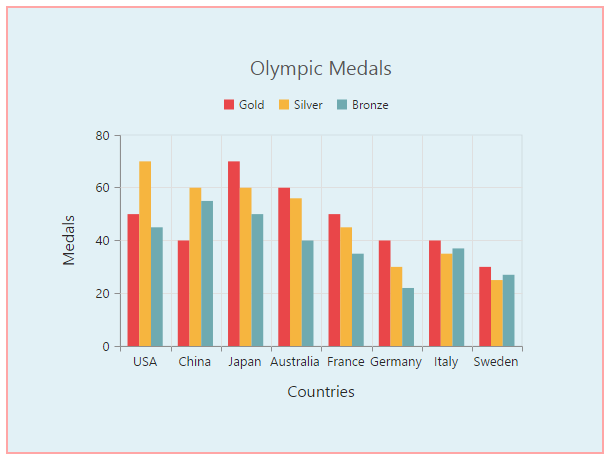
Setting background image
Background image can be added to the chart by using the [backGroundImageUrl] property.
<ej-chart id="chartcontainer"  backGroundImageUrl="wheat.png">

</ej-chart>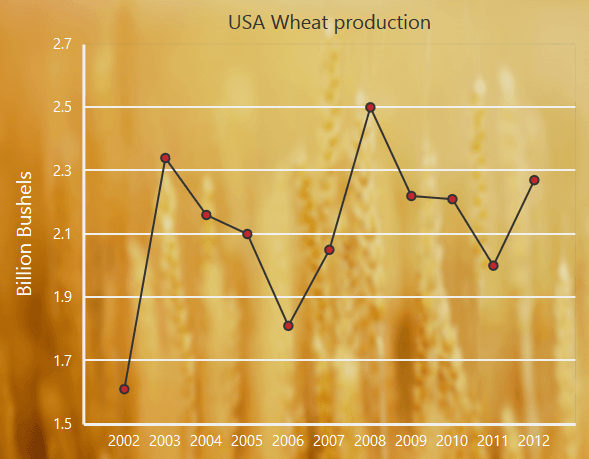
Chart area background
The Chart area background can be customized by using the [background] property in the chart area.
<ej-chart id="chartcontainer"  chartArea.background="skyblue">

</ej-chart>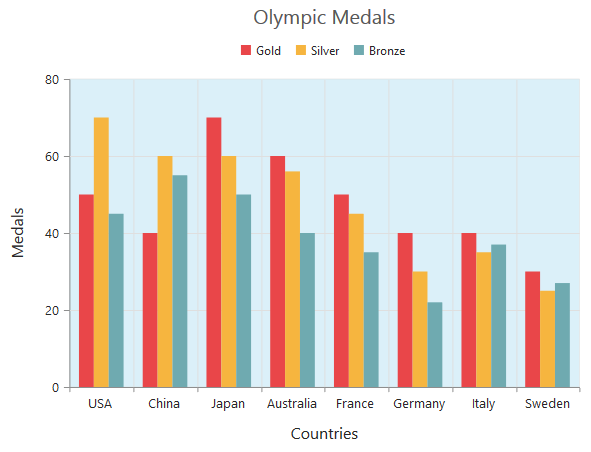
Customize chart area grid bands
You can provide different color for alternate grid rows and columns formed by the grid lines in the chart area by using the [alternateGridBand] property of the axis. The properties [odd] and [even] are used to customize the grid bands at odd and even positions respectively.
<ej-chart id="chartcontainer"  [primaryYAxis.alternateGridBand]="{even: {fill: '#A7A9AB',opacity: 0.1}">

</ej-chart>
Animation
You can enable animation by using the [enableAnimation] property of the series. This animates the chart series on two occasions – when the chart is loaded for the first time or whenever you change the series type by using the type property.
<ej-chart id="chartContainer">
    <e-seriescollection>
        <e-series [enableAnimation]="true">
		<-- Add points here-->
		</e-series>
    </e-seriescollection>

</ej-chart>
However, you can force the chart to animate series by calling the animate method as illustrated in the following code example,
<ej-chart id="chartContainer">
    <e-seriescollection>
        <e-series [enableAnimation]="true">
		<-- Add points here-->
		</e-series>
    </e-seriescollection>

</ej-chart>//Dynamically animating Chart
function animateChart(){
//Calling the animate method for dynamic animation
$("#chartContainer").ejChart("animate");
}Control the Speed of animation
To control the speed of animation, you can use the animationDuration property in the series.
<ej-chart id="chartcontainer">
    <e-seriescollection>
        <e-series [enableAnimation]="true" [animationDuration]="2000">
		<-- Add points here-->
		</e-series>
    </e-seriescollection>

</ej-chart>