Populating Data in Windows Forms Chart
18 Nov 201823 minutes to read
Built-in support for data-binding
Essential® Chart provides built-in support for binding DataTable, DataSet, DataView, or any implementation of IListSource, IBindingList, and ITypedList data sources. Both ChartSeries data points and axis labels can be data bound. Data binding must be configured programmatically because design-time data binding is not supported.
Data binding via custom interfaces
The chart also provides flexible support for implementing custom data models through specific interfaces. This approach allows data to be retrieved from and supplied to the chart from any type of data source.
One important reason to use either of these approaches is to improve performance, especially when working with a large number of data points, by reducing memory usage and increasing rendering speed.
Binding a dataset to the chart
The following code example demonstrates how to bind a custom DataSet to a ChartSeries using the ChartDataBindModel class. The ID column is used for the X values, the Population column is used for the Y values, and the City column is displayed as custom X-axis labels through the ChartDataBindAxisLabelModel class. A DataSet can also be replaced with a DataTable or DataView.
The following image illustrates the DataSet structure used for chart binding.
//Custom Dataset bound to the Demographics table
DataSet dataSet1 = new DataSet("DataSet1");
DataTable demographicsTable = new DataTable("Demographics");
demographicsTable.Columns.Add("ID", typeof(int));
demographicsTable.Columns.Add("City", typeof(string));
demographicsTable.Columns.Add("Population", typeof(int));
demographicsTable.Rows.Add(1, "Chennai", 8000000);
demographicsTable.Rows.Add(2, "Mumbai", 12400000);
demographicsTable.Rows.Add(3, "Delhi", 11000000);
demographicsTable.Rows.Add(4, "Bangalore", 8500000);
demographicsTable.Rows.Add(5, "Hyderabad", 6800000);
demographicsTable.Rows.Add(6, "Kolkata", 4500000);
dataSet1.Tables.Add(demographicsTable);
ChartDataBindModel model = new ChartDataBindModel(dataSet1, "Demographics");

//Column that contains the X values
model.XName = "ID";

//Column that contains the Y values
model.YNames = new string[] { "Population" };

//Configure the chart series
ChartSeries series = new ChartSeries("Data Bound Series");
series.Type = ChartSeriesType.Line;
series.SeriesModel = model;
this.chartControl.Series.Add(series);


//The columns that has the label values corresponding X values
ChartDataBindAxisLabelModel xAxisLabelModel = new ChartDataBindAxisLabelModel(dataSet1, "Demographics");
xAxisLabelModel.LabelName = "City";
this.chartControl.PrimaryXAxis.LabelsImpl = xAxisLabelModel;
this.chartControl.PrimaryXAxis.ValueType = ChartValueType.Custom;
'Custom Dataset bound to Demographics tables
Dim dataset As New DataSet("Dataset1")
Dim demographicstable As New DataTable("Demographics")
demographicstable.Columns.Add("ID", GetType(Integer))
demographicstable.Columns.Add("City", GetType(String))
demographicstable.Columns.Add("Population", GetType(Integer))
demographicstable.Rows.Add(1, "Chennai", 8000000)
demographicstable.Rows.Add(2, "Mumbai", 12400000)
demographicstable.Rows.Add(3, "Delhi", 11000000)
demographicstable.Rows.Add(4, "Bangalore", 8500000)
demographicstable.Rows.Add(5, "Hyderabad", 6800000)
demographicstable.Rows.Add(6, "Kolkata", 4500000)
dataset.Tables.Add(demographicstable)
Dim model As New ChartDataBindModel(dataset, "Demographics")
'Column that contains the X values
model.XName = "ID"
'Column that contains the Y values
model.YNames = New String() {"Population"}
'Configure the chart series
Dim series As ChartSeries = New ChartSeries("Data Bound Series")
series.Type = ChartSeriesType.Line
series.SeriesModel = model
chartControl.Series.Add(series)
'The columns that has the label values corresponding X values
Dim xaxislabelmodel = New ChartDataBindAxisLabelModel(dataset, "Demographics")
xaxislabelmodel.LabelName = "City"
chartControl.PrimaryXAxis.LabelsImpl = xaxislabelmodel
chartControl.PrimaryXAxis.ValueType = ChartValueType.Custom {height:”350”, width=”350”}
Implementing custom data binding interfaces
The IChartSeriesModel interface can be implemented to provide custom data to the chart. The interface requires one property, two methods, and an optional event.
The following code example demonstrates a custom implementation of the IChartSeriesModel interface.
// Custom Model

public class ArrayModel : IChartSeriesModel
{
      private double[] data;

      public ArrayModel(double[] data)
      {
         this.data = data;
      }

      // Returns the number of points in this series.
      public int Count
      {
         get
         {
            return this.data.GetLength(0);
         }
      }

      // Returns the Y value of the series at the specified point index.
      public double[] GetY(int xIndex)
      {
         return new double[] { data[xIndex] };
      }

      // Returns the X value of the series at the specified point index.
      public double GetX(int xIndex)
      {
         return xIndex;
      }

      // Indicates whether a specified point index has a value which can be plotted.
      public bool GetEmpty(int index)
      {
         return false;
      }

      // Event that should be raised by any implementation of this interface if data that it holds changes. This will cause the chart to be updated accordingly. We don't raise this event in our implementation as our data will be static.
      public event ListChangedEventHandler Changed;
}
Public Class ArrayModel
Implements IChartSeriesModel
Private data() As Double
Public Sub New(ByVal data() As Double)
Me.data = data
End Sub
' Returns the number of points in this series.
Public ReadOnly Property Count() As Integer _
Implements IChartSeriesModel.Count
Get
Return Me.data.Length
End Get
End Property
'Public Function GetY(ByVal xIndex As Integer) As Double() _
' Implements IChartSeriesModel.GetY
Public Function GetY(ByVal xIndex As Integer) As Double() _
Implements IChartSeriesModel.GetY
Return New Double() {data(xIndex)}
End Function
Public Function GetX(ByVal xIndex As Integer) As Double _
Implements IChartSeriesModel.GetX
Return xIndex
End Function
Public Function GetEmpty(ByVal index As Integer) As Boolean _
Implements IChartSeriesModel.GetEmpty
Return False
End Function
Public Event Changed As ListChangedEventHandler _
Implements IChartSeriesModel.Changed
End ClassBind the above model to the chart series
//Creating series data and binding to the array model
ChartSeries series = new ChartSeries("Series");
series.SeriesModel = new ChartLegendSample.ArrayModel(new double[] { 22, 24, 32, 12, 18 });
series.Type = ChartSeriesType.Bar;
this.chartControl.Series.Add(series);
'Creating series data and binding to the array model
Dim series As New ChartSeries("Series")
series.SeriesModel = New ArrayModel(New Double() {22, 24, 32, 12, 18})
series.Type = ChartSeriesType.Bar
Me.chartControl.Series.Add(series)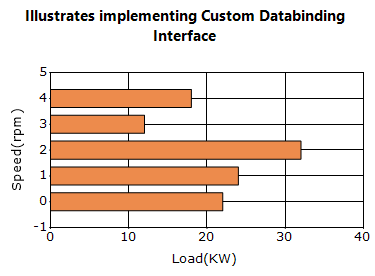
Indexed data
If the X-values represent indexed categories, you can implement the IChartSeriesIndexedModel interface and bind it to the SeriesIndexedModelImpl property of a ChartSeries. Unlike IChartSeriesModel, this interface does not require an implementation of the GetX method.
Bind IEnumerable data
The Windows Forms Chart supports binding IEnumerable data sources, such as ArrayList, for indexed and non-indexed data through the ChartDataBindModel class.
class PopulationData
{
    private string city;

    public string City
    {
        get { return city; }
        set { city = value; }
    }

    private double population;

    public double Population
    {
        get { return population; }
        set { population = value; }
    }

    public PopulationData(string city, double population)
    {
        this.city = city;
        this.population = population;
    }
}
Class PopulationData
Private m_city As String
Public Property City() As String
Get
Return m_city
End Get
Set(ByVal value As String)
m_city = value
End Set
End Property
Private m_population As Double
Public Property Population() As Double
Get
Return m_population
End Get
Set(ByVal value As Double)
m_population = value
End Set
End Property
Public Sub New(ByVal city As String, ByVal population As Double)
Me.City = city
Me.Population = population
End Sub
End ClassIf the data source is stored in an ArrayList, create a ChartDataBindModel by supplying the collection instance.
In this example, only the YNames property is mapped, so the data is treated as non-indexed and X-axis values are not displayed. To display custom X-axis labels, use the ChartDataBindAxisLabelModel class. This class binds axis labels from the same data source in a manner similar to ChartDataBindModel.
ArrayList populations = new ArrayList();
populations.Add(new PopulationData("New York", 13));
populations.Add(new PopulationData("Houston", 6));
populations.Add(new PopulationData("Tokyo", 17));
populations.Add(new PopulationData("London", 15));
populations.Add(new PopulationData("Los Angels", 11));
ChartSeries series = new ChartSeries("Populations");
ChartDataBindModel dataSeriesModel = new ChartDataBindModel(populations);

// If ChartDataBindModel.XName is empty or null, X value is index of point.
//Here I have assigned the property name Population as Y axis name and ChartDataBindModel automatically detects the Population property and will bind the data from it.

dataSeriesModel.YNames = new string[] { "Population" };

//Binding the ChartDataBindModel with the Series. This is the best practice for binding with the large amount of data since it will reduce the performance issue of Chart rendering and manipulating data.
series.SeriesModel = dataSeriesModel;

//Since we have specified YNames only for the DataBind model, it will take the data source is non indexed model and it will ignore the X axis values. We need to assign the X axis values what we need to show on X axis by ChartDataBindAxisLabelModel separately.

ChartDataBindAxisLabelModel dataLabelsModel = new ChartDataBindAxisLabelModel(populations);
dataLabelsModel.LabelName = "City";
chartControl.Series.Add(series);
chartControl.PrimaryXAxis.ValueType = ChartValueType.Custom;
chartControl.PrimaryXAxis.LabelsImpl = dataLabelsModel;
Dim populations As New ArrayList()
populations.Add(New PopulationData("New York", 13))
populations.Add(New PopulationData("Houston", 6))
populations.Add(New PopulationData("Tokyo", 17))
populations.Add(New PopulationData("London", 15))
populations.Add(New PopulationData("Los Angeles", 11))
Dim series As New ChartSeries("Populations")
Dim dataSeriesModel As New ChartDataBindModel(populations)
'If ChartDataBindModel.XName is empty or null, X value is index of point.
'Here I have assigned the property name Population as Y axis name and ChartDataBindModel automatically detects the Population property and will bind the data from it.
dataSeriesModel.YNames = New String() {"Population"}
'Binding the ChartDataBindModel with the Series. This is the best practice for binding with the large amount of data since it will reduce the performance issue of Chart rendering and manipulating data.
series.SeriesModel = dataSeriesModel
'Since we have specified YNames only for the DataBind model, it will take the data source is non indexed model and it will ignore the X axis values. We need to assign the X axis values what we need to show on X axis by ChartDataBindAxisLabelModel separately.
Dim dataLabelsModel As New ChartDataBindAxisLabelModel(populations)
dataLabelsModel.LabelName = "City"
chartControl.Series.Add(series)
chartControl.PrimaryXAxis.ValueType = ChartValueType.Custom
chartControl.PrimaryXAxis.LabelsImpl = dataLabelsModel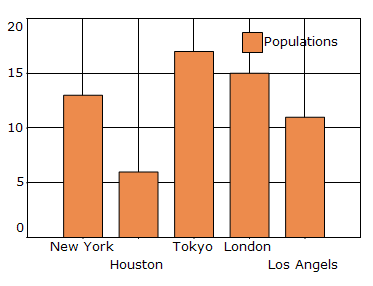
Bind a data source to a WinForms chart using the chart wizard
The Chart Wizard allows you to bind a data source to the Windows Forms Chart control and configure the chart at design time.
Follow these steps to add the Chart control and prepare the design-time data schema:
Step-1: Open the Windows Forms project in Visual Studio.
Step-2: Open the Toolbox, expand Syncfusion Windows Forms, and drag the ChartControl onto the form.
Step-3: Select the Chart control, click the Smart Tag (►), and choose Chart Wizard.
 {height:”350”, width:”350”}
Step-4: Open the Toolbox and drag a BindingSource component onto the form. The component appears in the component tray as bindingSource1.
 {height:”350”, width=”350”}
Step-5: Open the Project menu and select Add New Item. In the Add New Item dialog, select DataSet, name it DataSet1, and click Add. The DataSet provides the design-time schema required by the Chart Wizard to identify the X and Y fields.
 {height:”350”, width=”350”}
Step-6: Open DataSet1 in the DataSet Designer. Right-click the designer surface, choose Add, and select DataTable.
Step-7: Right-click the DataTable, choose Add, and select Column. Create Month as a string column and Sales as an int column.
 {height:”350”, width=”350”}
The Chart Wizard is available only in .NET Framework projects and is not supported in .NET Core WinForms applications.
Binding the table data with chart series
After creating the DataTable, connect it to the BindingSource and select the data source in the Chart Wizard.
Step-1: Right-click bindingSource1 in the component tray and select Properties.
Step-2: In the Properties window, open the DataSource property, expand Form1 List Instances, and select dataSet1.
Step-3: Open the DataMember property and select DataTable1. The BindingSource now exposes the Month and Sales fields to the Chart Wizard.
 {height:”350”, width=”350”}
Step-4: Select chartControl1, click the Smart Tag (►), and choose Chart Wizard.
Step-5: In the Chart Wizard, select Series, and then open the Data Source tab.
Step-6: Select bindingSource1 from the Data Source list. The data grid displays the Month and Sales fields exposed by the BindingSource.
If the form does not contain a BindingSource, only the [None] and [New BindingSource…] options are displayed in the Chart Wizard’s Data Source list.
 {height:”350”, width=”350”}
Binding chart with a binding source
You can bind the Chart with a BindingSource in either designer or code behind.
Bind chart with a binding source in designer
After selecting the BindingSource as the chart data source, map its fields to the required chart series.
Step-1: In the Chart Wizard, open the Series Data tab.
Step-2: Select the required series, such as Default0.
Step-3: Select Month from the X Value list and Sales from the Y Value list.
Step-4: Select the required chart type, such as Line or Column. You can also modify the series name in this tab.
 {height:”350”, width=”350”}
*Step-5: To add data points through the Chart Wizard, open the Add points to series tab under Series.
Step-6: Select Default0 from the Add Points list, and then click Edit points to open the ChartPoint Collection Editor.
Step-7: In the ChartPoint Collection Editor, click Add and select the newly added point from the Members list.
Step-8: Specify the required values:
- Set X to the required X value.
- Set YValues to the required Y value.
Step-9: Repeat these steps to add the remaining data points, and then click OK to close the editor.
Step-10: Return to the Chart Wizard, click Apply, and then click Finish.
 {height:”350”, width=”350”}
The following image illustrates the pie chart configured in the Chart Wizard at design time.
 {height:”350”, width=”350”}
The following image illustrates the pie chart displayed when the application runs.
 {height:”350”, width=”350”}
For more details, refer to How to bind a data source to a WinForms Chart using the Chart Wizard.
Bind chart with a binding source in code behind
Binding a chart to a BindingSource in code is similar to binding an IEnumerable data source. The following steps demonstrate how to bind a BindingSource to a ChartSeries.
Step-1:
Create a ChartDataBindModel object with BindingSource as data source.
//Using BindingSource as data source to the ChartDataBindModel
ChartDataBindModel model = new ChartDataBindModel(MyBindingSource);
'Using BindingSource as data source to the ChartDataBindModel
Dim model As New ChartDataBindModel(MyBindingSource)Step-2:
Provide a field name in binding source as value to the XName property of the ChartDataBindModel object.
//Mapping XName to a field in BindingSource object
model.XName = "Field1";
'Mapping XName to the field in BindingSource object
model.XName = "Field1"Step-3:
Similarly, provide a field name in binding source as value to the YNames property of the ChartDataBindModel object. The YNames property accepts an array of string as value because series types like candle, Gantt, Histogram, etc., require more than one Y Value.
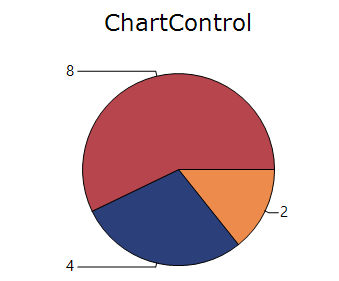
As this example uses a pie chart, a single field name is sufficient for the YNames property of the ChartDataBindModel object.
//Mapping YNames to a field in BindingSource object
model.YNames = new string[] { "Field2" };
'Mapping YNames to a field in BindingSource object
model.YNames = New String() {"Field2"}Step-4:
Set ChartDataBindModel object as value to the ChartSeries object. This binds the Series with BindingSource.
//Bind ChartDataBindModel object with Series
series.SeriesModel = model;
'Bind ChartDataBindModel object with Series
series.SeriesModel = modelThe following screenshot displays a Chart bounded with binding source in code behind.
Data manipulation
Essential® Chart provides a series model implementation that works directly with grouped data. It supports filters, summaries, and computed expressions, and also allows custom summaries and filters to be displayed in the chart.
Grouping support
The Enterprise Edition of Essential® Chart includes grouping support that works directly with grouped data. It supports built-in and custom filters and summaries, allowing grouped data to be visualized in the chart.
The following images demonstrate stock transaction data grouped by symbol to calculate total volume and filtered to display specific transaction records. The chart works directly with live grouped data rather than a filtered or grouped copy, and any changes made to the underlying data are automatically reflected in the chart.

A sample application that illustrates grouping and filtering support is distributed with Essential® Chart and can be found at:
Sample Location: <sample installation location>\Syncfusion\EssentialStudio\Version Number\Windows\chart\Data Binding\Chart Grouping
Essential® grid interaction
Essential® Chart provides integration with Essential® Grid through a shared data model. The grid can also serve as a data source for the chart, allowing selected grid columns to be mapped automatically to chart series. The following image illustrates a chart created from grid data.

A sample application that illustrates chart and grid integration is distributed with Essential® Chart and can be found at:
Sample Location: “<sample installation location>\Syncfusion\EssentialStudio\Version Number\Windows\chart\Embed Custom Control”
Real time
Essential® Chart is optimized for visualizing large volumes of real-time data and supports smooth updates across the available chart types.
Real-time updates can be achieved by updating the chart data points and, when required, adjusting the chart axis ranges. Although new data points can be added through the ChartSeries.Points collection, using a custom data model is recommended for better performance in real-time scenarios.
A sample application that illustrates real time data usage which is distributed along with the Essential® Chart installation and can be found at:
Sample Location: “<sample installation location>\Syncfusion\EssentialStudio\Version Number\Windows\chart\Real Time\Chart Recorder”
See also
- How to create a real-time chart in WF
- How do I use Essential Chart to visualize data from Essential Grid
- How to bind a data source to a WinForms Chart using the chart wizard
- How to bind a dataset from a database to the WinForms Chart
- How to I set Custom Data binding in Chart
- How to customize data points in Windows Forms Chart
- How to filter data points in Windows Forms Chart
- How do I filter particular set of data points in the WinForms Chart series