Getting Started with Flutter Spark Chart
18 Nov 20189 minutes to read
This section explains the steps required to populate the spark charts with data, data labels, and trackball. It covers only the minimal features needed to get started with spark charts.
Add Flutter Spark charts to an application
Create a new Flutter project by following the instructions in the Getting Started with your first Flutter app documentation.
Add dependency
Add the Syncfusion® Flutter Charts package dependency to your pubspec.yaml file.
dependencies:

    syncfusion_flutter_charts: ^xx.x.xx
NOTE
Here xx.x.xx denotes the current version ofSyncfusion® Flutter Chartspackage.
Get packages
Run the following command to get the required packages.
$ flutter pub getImport package
Import the following package in your Dart code.
import 'package:syncfusion_flutter_charts/sparkcharts.dart';Initialize spark charts
Once the package has been imported, place the spark chart as a child of any widget. Here, as we are rendering a line chart, initialize SfSparkLineChart as a child of the Container widget.
@override
    Widget build(BuildContext context) {
        return Scaffold(
            body: Center(
                child: Container(
                    //Initialize the spark charts
                    child: SfSparkLineChart()
                )
            )
        );
    }
Bind data source
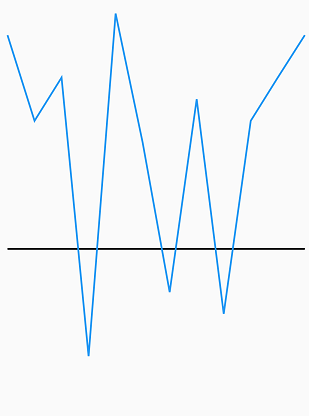
Use the data property to bind data to the spark charts. This property accepts a list of numeric values.
@override
    Widget build(BuildContext context) {
        return Scaffold(
            body: Center(
                child: Container(
                    //Initialize the spark line chart
                    child: SfSparkLineChart(
                        data: <double>[
                            10, 6, 8, -5, 11, 5, -2, 7, -3, 6, 8, 10
                        ]
                    )
                ),
            )
        );
    }
Spark charts types
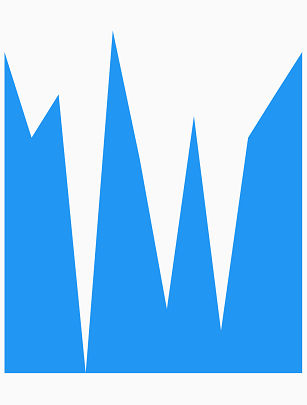
You can use the following widgets to create spark charts: SfSparkLineChart, SfSparkAreaChart, SfSparkBarChart, or SfSparkWinLossChart.
In this example, the spark chart type is set to SfSparkAreaChart.
@override
    Widget build(BuildContext context) {
        return Scaffold(
            body: Center(
                child: Container(
                    //Initialize the spark area chart
                    child: SfSparkAreaChart(
                        axisLineWidth:0,
                         data: <double 0,
                        data: <double>[
                            10,
                    )
                ),
            )
        );
    }
Enable data labels
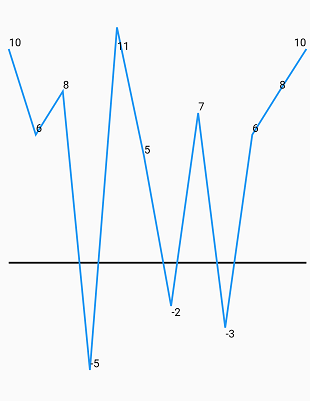
You can add data labels to improve chart readability by using the labelDisplayMode property.
@override
    Widget build(BuildContext context) {
        return Scaffold(
            body: Center(
                child: Container(
                    //Initialize spark line chart
                    child: SfSparthe spark line chart
                    child: SfSparkLineChart(
                        //Enable data labels
                        labelDisplayMode: SparkChartLabelDisplayMode.all,
                        data: <double>[
                            10,
                    )
                )
            )
        );
    }
Enable trackball for spark chart
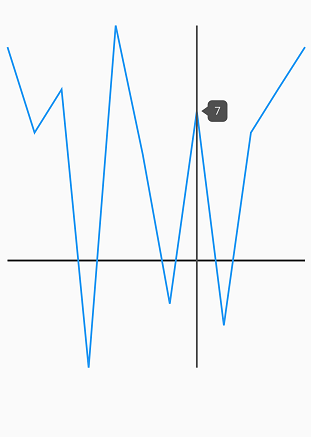
The spark charts display additional information through trackball when you tap a specific location in the chart area. You can enable the trackball by setting the trackball property to SparkChartTrackball. Once it is activated, it appears in the UI and moves based on your touch movement until you stop touching the chart.
@override
    Widget build(BuildContext context) {
        return Scaffold(
            body: Center(
                child: Container(
                    child: SfSparkLineChart(
                        //Enable trackball
                        trackball: SparkChartTrackball(
                            activationMode: SparkChartActivationMode.tap
                        ),
                        data: <double>[
                            10, 6, 8, -5, 11, 5, -2, 7, -3, 6, 8, 10
                        ]
                    )
                )
            )
        );
    }