Annotation in Flutter Circular Chart
18 Nov 20189 minutes to read
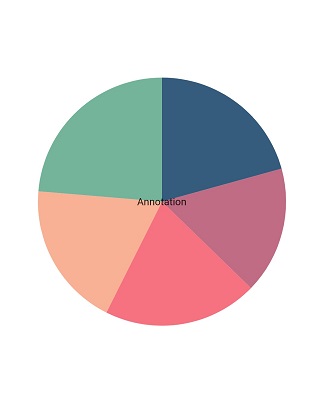
The chart supports annotations, which allow you to mark a specific area of interest in the chart area. You can add custom widgets using this annotation feature, as shown below.
@override
    Widget build(BuildContext context) {
      return Scaffold(
        body: SafeArea(
          child: Center(
            child: Container(
              child: SfCircularChart(
                annotations: <CircularChartAnnotation>[
                  CircularChartAnnotation(
                    widget:
                      Container(
                        child: const Text('Annotation')
                      ),
                  )
                ]
              )
            )
          )
        )
      );
    }
Positioning the annotation
The horizontalAlignment and verticalAlignment values can be specified to align the annotation widget horizontally or vertically, and the radius property can be used to place the annotation, with values ranging from 0% to 100%.
Defaults to 0%.
Positioning based on Alignment and Radius
To place the annotation based on the radius value, set the radius. To change the annotation alignment, use the horizontalAlignment and verticalAlignment properties, as shown in the following code snippet.
@override
    Widget build(BuildContext context) {
      return Scaffold(
        body: SafeArea(
          child: Center(
            child: Container(
              child: SfCircularChart(
                annotations: <CircularChartAnnotation>[
                  CircularChartAnnotation(
                    widget: Container(
                      child: const Text('Text')
                    ),
                    radius: '50%',
                    verticalAlignment: ChartAlignment.center,
                    horizontalAlignment: ChartAlignment.far
                  )
                ]
              )
            )
          )
        )
      );
    }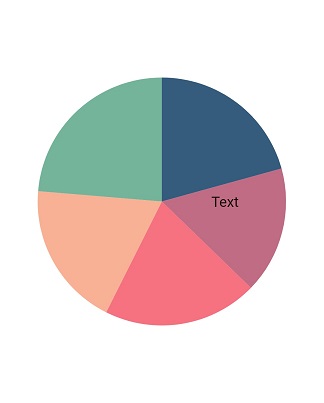
Chart with watermark
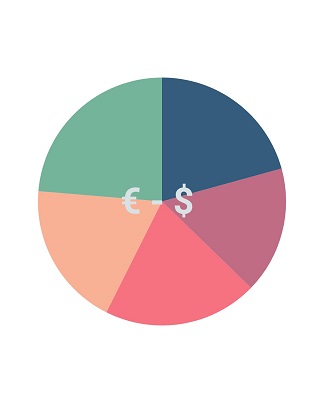
The chart supports watermark, which allows you to mark a specific area of interest in the chart area. You can add custom widgets and watermarks using this annotation feature, as shown below.
@override
    Widget build(BuildContext context) {
      return Scaffold(
        body: SafeArea(
          child: Center(
            child: Container(
                  child: SfCircularChart(
                      annotations: <CircularChartAnnotation>[
                      CircularChartAnnotation(
                        widget: Container(
                        child: const Text(
                        '€ - \$ ',
                        style: TextStyle(
                        color: Color.fromRGBO(216, 225, 227, 1),
                        fontWeight: FontWeight.bold,
                        fontSize: 80)),
                        ),
                      )
                    ],
                    series: <PieSeries<ChartData, String>>[
                    PieSeries<ChartData, String>(
                      dataSource: <ChartData>[
                      ChartData('jan', 37),
                      ChartData('feb', 24),
                      ChartData('mar', 36),
                      ChartData('apr', 38),
                      ChartData('may', 40),
                      ],
                      xValueMapper: (ChartData data, _) => data.x,
                      yValueMapper: (ChartData data, _) => data.y),
                      ],
                    )
                  )
                )
              )
            );
          }

        class ChartData {
          ChartData(this.x, this.y);
          final String x;
          final double y;
        }