Getting Started with JavaScript PivotGrid
3 May 202124 minutes to read
Creating a simple application with PivotGrid and Relational datasource (Client Mode)
This section explains about the steps required to populate a simple PivotGrid with relational data completely on the client-side.
Scripts and CSS references
Create a HTML page and add scripts and style sheets that are mandatorily required to render a PivotGrid widget which are listed below in an appropriate order.
- ej.web.all.min.css
- jQuery-3.0.0.min.js
- ej.web.all.min.js
Initialize PivotGrid
Place a “div” tag in the HTML page which acts as a container for the PivotGrid widget. Then, initialize the widget using the “ejPivotGrid” method.
<!DOCTYPE html>
<html>
<head>

    <title>PivotGrid - Getting Started</title>

    <link href="http://cdn.syncfusion.com/28.1.33/js/web/flat-azure/ej.web.all.min.css" rel="stylesheet" type="text/css" />
    <script src="http://cdn.syncfusion.com/js/assets/external/jquery-3.0.0.min.js" type="text/javascript"></script>
    <script src="http://cdn.syncfusion.com/28.1.33/js/web/ej.web.all.min.js" type="text/javascript"></script>

</head>
<body>
    <!--Create a tag which acts as a container for ejPivotGrid widget.-->
    <div id="PivotGrid1" style="height: 350px; width: 100%; overflow: auto">
    </div>

    <script type="text/javascript">
        $(function () {
            //Set properties and initialize ejPivotGrid widget.
            $("#PivotGrid1").ejPivotGrid();
        });
    </script>
</body>
</html>
Populate PivotGrid with data
Here, you can see how to populate the PivotGrid control by using a sample JSON data as shown below:
var pivotData = [
    { Amount: 100, Country: "Canada", Date: "FY 2005", Product: "Bike", Quantity: 2, State: "Alberta" },
    { Amount: 200, Country: "Canada", Date: "FY 2006", Product: "Van", Quantity: 3, State: "British Columbia" },
    { Amount: 300, Country: "Canada", Date: "FY 2007", Product: "Car", Quantity: 4, State: "Brunswick" },
    { Amount: 150, Country: "Canada", Date: "FY 2008", Product: "Bike", Quantity: 3, State: "Manitoba" },
    { Amount: 200, Country: "Canada", Date: "FY 2006", Product: "Car", Quantity: 4, State: "Ontario" },
    { Amount: 100, Country: "Canada", Date: "FY 2007", Product: "Van", Quantity: 1, State: "Quebec" },
    { Amount: 200, Country: "France", Date: "FY 2005", Product: "Bike", Quantity: 2, State: "Charente-Maritime" },
    { Amount: 250, Country: "France", Date: "FY 2006", Product: "Van", Quantity: 4, State: "Essonne" },
    { Amount: 300, Country: "France", Date: "FY 2007", Product: "Car", Quantity: 3, State: "Garonne (Haute)" },
    { Amount: 150, Country: "France", Date: "FY 2008", Product: "Van", Quantity: 2, State: "Gers" },
    { Amount: 200, Country: "Germany", Date: "FY 2006", Product: "Van", Quantity: 3, State: "Bayern" },
    { Amount: 250, Country: "Germany", Date: "FY 2007", Product: "Car", Quantity: 3, State: "Brandenburg" },
    { Amount: 150, Country: "Germany", Date: "FY 2008", Product: "Car", Quantity: 4, State: "Hamburg" },
    { Amount: 200, Country: "Germany", Date: "FY 2008", Product: "Bike", Quantity: 4, State: "Hessen" },
    { Amount: 150, Country: "Germany", Date: "FY 2007", Product: "Van", Quantity: 3, State: "Nordrhein-Westfalen" },
    { Amount: 100, Country: "Germany", Date: "FY 2005", Product: "Bike", Quantity: 2, State: "Saarland" },
    { Amount: 150, Country: "United Kingdom", Date: "FY 2008", Product: "Bike", Quantity: 5, State: "England" },
    { Amount: 250, Country: "United States", Date: "FY 2007", Product: "Car", Quantity: 4, State: "Alabama" },
    { Amount: 200, Country: "United States", Date: "FY 2005", Product: "Van", Quantity: 4, State: "California" },
    { Amount: 100, Country: "United States", Date: "FY 2006", Product: "Bike", Quantity: 2, State: "Colorado" },
    { Amount: 150, Country: "United States", Date: "FY 2008", Product: "Car", Quantity: 3, State: "New Mexico" },
    { Amount: 200, Country: "United States", Date: "FY 2005", Product: "Bike", Quantity: 4, State: "New York" },
    { Amount: 250, Country: "United States", Date: "FY 2008", Product: "Car", Quantity: 3, State: "North Carolina" },
    { Amount: 300, Country: "United States", Date: "FY 2007", Product: "Van", Quantity: 4, State: "South Carolina" }
];
Now, set the JSON data to the “data” property that is present inside the “dataSource” object. “dataSource” object allows you to set both datasource and fields that need to be displayed in the row, column, value, and filter section of the PivotGrid control.
<!DOCTYPE html>
<html>
//……
<body>
<div id="PivotGrid1" style="height: 350px; width: 100%; overflow: auto">
</div>
<script type="text/javascript">
//Datasource
var pivotData = [
{ Amount: 100, Country: "Canada", Product: "Bike", Quantity: 1 },
{ Amount: 200, Country: "Germany", Product: "Van", Quantity: 1 },
{ Amount: 300, Country: "Germany", Product: "Car", Quantity: 1 },
{ Amount: 150, Country: "United Kingdom", Product: "Bike", Quantity: 1 },
{ Amount: 200, Country: "Canada", Product: "Car", Quantity: 1 },
....
....
]
$(function () {
$("#PivotGrid1").ejPivotGrid({
dataSource: {
//Datasource bound to PivotGrid control.
data: pivotData,
//Required fields in row, column, value and filter areas of PivotGrid control.
rows: [
{
fieldName: "Country",
fieldCaption: "Country"
}
],
columns: [
{
fieldName: "Product",
fieldCaption: "Product"
}
],
values: [
{
fieldName: "Amount",
fieldCaption: "Amount"
}
]
}
});
});
</script>
</body>
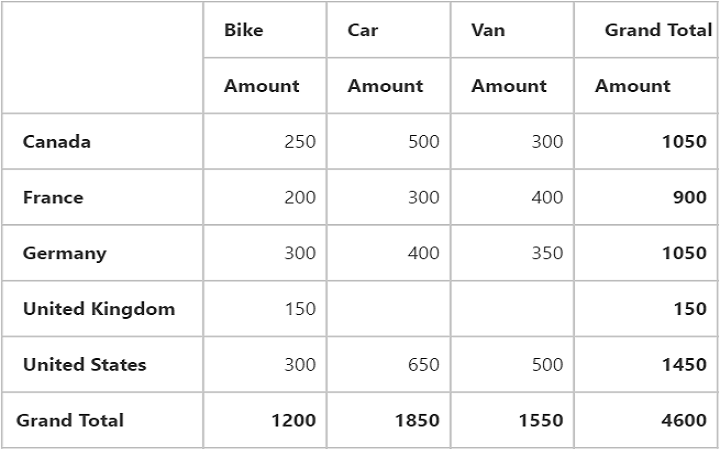
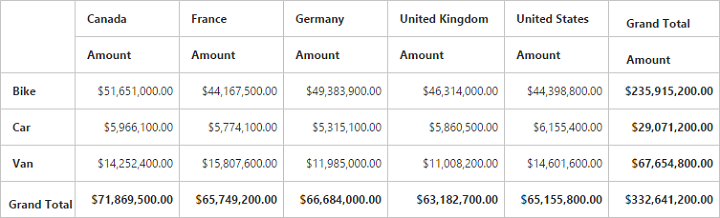
</html>The above code will generate a simple PivotGrid with “Country” field in row, “Product” field in column, and “Amount” field in value section.
The following table will explain the relational datasource properties at client-side in detail:
| Properties | Description | ||||||||||||||||||||||||||||
|---|---|---|---|---|---|---|---|---|---|---|---|---|---|---|---|---|---|---|---|---|---|---|---|---|---|---|---|---|---|
Lists out the items to be arranged in the columns section of the PivotGrid.
|
|||||||||||||||||||||||||||||
Lists out the items to be arranged in the rows section of the PivotGrid.
|
|||||||||||||||||||||||||||||
Lists out the items that support calculation in the PivotGrid.
|
|||||||||||||||||||||||||||||
Lists out the items which supports filtering of values without displaying the members in UI of the PivotGrid.
|
Apply sorting
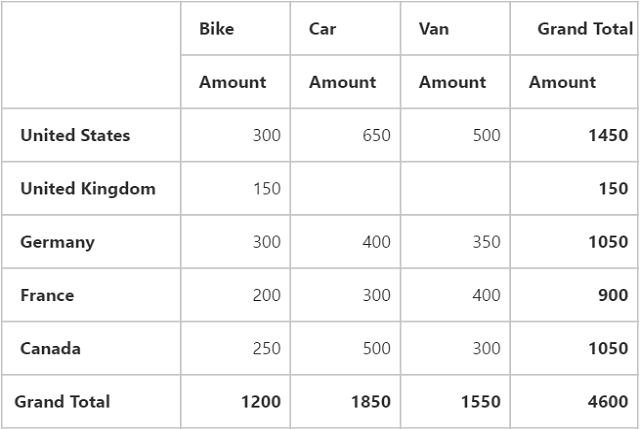
You can sort a field in ascending or descending order by using the “sortOrder” property. Sorting is applicable only for row and column fields. By default, fields are arranged in the ascending order.
$(function () {
    $("#PivotGrid1").ejPivotGrid({
        dataSource: {
            data: pivotData,
            rows: [{
                fieldName: "Country",
                fieldCaption: "Country",
                sortOrder: ej.PivotAnalysis.SortOrder.Descending
            }
            ],
            //……
        }
    });
});
Sort row/column by date
You can sort a field in ascending or descending order according to date type by using the sortOrder property.
NOTE
To apply sorting by date, you should specify the
formatandformatStringin the field.
<!DOCTYPE html>
<html>
//……
<body>
    <div id="PivotGrid1" style="height: 350px; width: 100%; overflow: auto">
    </div>
    <script type="text/javascript">
        //Datasource
        var pivotData = [
            { Amount: 100, Date: "5-1-2017", Day: "Wednesday" },
            { Amount: 200, Date: "1-2-2017", Day: "Sunday" },
            { Amount: 300, Date: "1-1-2018", Day: "Thursday" },
            { Amount: 150, Date: "5-1-2018", Day: "Wednesday" },
            { Amount: 200, Date: "1-2-2017", Day: "Thursday" },
            { Amount: 100, Date: "1-1-2018", Day: "Sunday" },
            { Amount: 200, Date: "5-1-2017", Day: "Wednesday" },
            { Amount: 250, Date: "1-2-2017", Day: "Sunday" }
            //....
        ];
        $(function () {
            $("#PivotGrid1").ejPivotGrid({
                dataSource: {
                    //Datasource bound to PivotGrid control.
                    data: pivotData,
                    rows: [{
                                fieldName: "Date",
                                fieldCaption: "Date",
                                format: "date",
                                formatString: "dd-MM-yyy",
                                sortOrder: ej.PivotAnalysis.SortOrder.Descending
                        }],
                        columns: [{
                                fieldName: "Day",
                                fieldCaption: "Day",
                                format: "date",
                                formatString: "ddd",
                                sortOrder: ej.PivotAnalysis.SortOrder.Ascending
                         }],
                    //..
                }
            });
        });
    </script>
</body>
</html>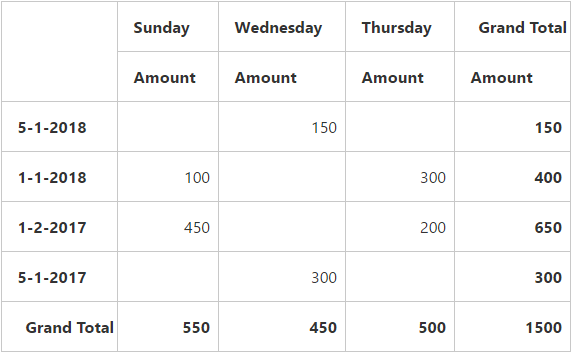
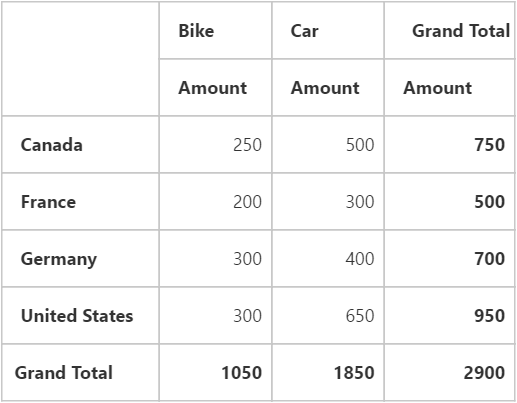
Apply filtering
Filtering option allows you to show or hide a set of values. Also filtering option is applicable only for row, column, and filter areas.
“filterItems” object allows you to apply filtering to fields by using the following properties:
- filterType - indicates whether the values should be included or excluded.
- values - specify an array of values that needs to be included or excluded within the particular field.
$(function () {
    $("#PivotGrid1").ejPivotGrid({
        dataSource: {
            data: pivotData,
            rows: [{
                fieldName: "Country",
                fieldCaption: "Country",
                filterItems: {
                    filterType: ej.PivotAnalysis.FilterType.Exclude,
                    values: ["United Kingdom"]
                }
            }
            ],
            columns: [{
                fieldName: "Product",
                fieldCaption: "Product",
                filterItems: {
                    filterType: ej.PivotAnalysis.FilterType.Include,
                    values: ["Bike", "Car"]
                }
            }
            ],
        //……
        }
    });
});
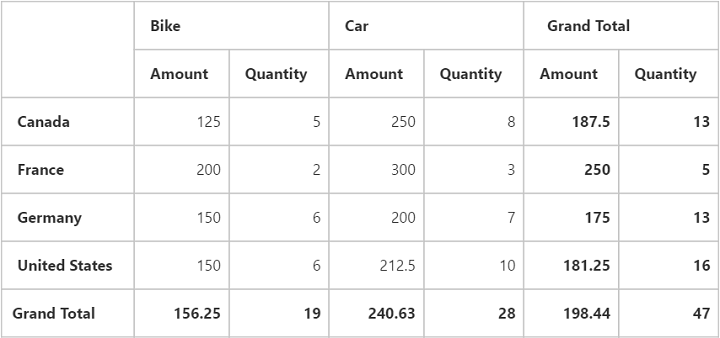
Apply summary types
Allows you to specify the required summary type which should be used in summary cells of the PivotGrid. “sum” is the default summary type. Following are the supported summary types:
- sum
- average
- count
- min
- max
$(function () {
    $("#PivotGrid1").ejPivotGrid({
        dataSource: {
            data: pivotData,
            //……
            values: [{
                fieldName: "Amount",
                fieldCaption: "Amount",
                summaryType: ej.PivotAnalysis.SummaryType.Average
            },
            {
                fieldName: "Quantity",
                fieldCaption: "Quantity",
                summaryType: ej.PivotAnalysis.SummaryType.Sum
            }
            ]
        }
    });
});
Creating a simple application with PivotGrid and relational datasource (server mode)
This section covers the information required to create a simple PivotGrid that is bound to the relational datasource.
NOTE
This section illustrates creating a simple Web Application through the Visual Studio IDE since the PivotGrid is a
server-sidecontrol with .NET dependency. The Web Application contains a HTML page and a service that would transfer data toserver-side, process, and return back the data toclient-sidefor control re-rendering. The service utilized for communicate could be either WCF or WebAPI based on user requirement. Here, both WCF and WebAPI have been illustrated for user convenience.
Project initialization
Create a new ASP.NET Empty Web Application by using the Visual Studio IDE and name the project as “PivotGridDemo”.
Next, you should add a HTML page. To add a HTML page in the Web Application, right-click the project in the solution explorer and select Add > New Item. In the Add New Item window, select HTML Page and name it as “GettingStarted.html”, and then click Add.
You can set “GettingStarted.html” as start-up page by right-clicking the “GettingStarted.html” page and selecting the “Set As Start Page”.
Scripts and CSS initialization
The scripts and style sheets that are mandatorily required to render a PivotGrid widget inside a HTML page are listed below in an appropriate order.
- ej.web.all.min.css
- jQuery-3.0.0.min.js
- ej.web.all.min.js
The scripts and style sheets listed above could be found in any of the following locations:
Local disk: Click here to know more about script and style sheets installed in the local machine.
CDN link: Click here to know more about script and style sheets available in online.
NuGet package: Click here to know more about script and style sheets available in the NuGet package.
Control initialization
To initialize a PivotGrid widget, you can define a “div” tag with an appropriate “id” attribute which acts as a container for the PivotGrid widget. Then, you can initialize the widget using the ejPivotGrid method.
<!DOCTYPE html>
<html xmlns="http://www.w3.org/1999/xhtml">

<head>
    <title>PivotGrid - Getting Started</title>
    <link href="http://cdn.syncfusion.com/28.1.33/js/web/flat-azure/ej.web.all.min.css" rel="stylesheet" type="text/css" />
    <script src="http://cdn.syncfusion.com/js/assets/external/jquery-3.0.0.min.js" type="text/javascript"></script>
    <script src="http://cdn.syncfusion.com/28.1.33/js/web/ej.web.all.min.js" type="text/javascript"></script>
</head>

<body>
    <!--Create a tag which acts as a container for ejPivotGrid widget.-->
    <div id="PivotGrid1" style="height: 350px; width: 100%; overflow: auto"> </div>
    <script type="text/javascript">
        //Set properties and initialize ejPivotGrid widget.
        $(function () {
            $("#PivotGrid1").ejPivotGrid(
            {
                url: "/Relational"
            });
        });
    </script>
</body>
</html>
The “url” property in the PivotGrid widget, points the service endpoint where the data are processed and fetched in the form of JSON. The service used for the PivotGrid widget as endpoint are the WCF and WebAPI.
WebAPI
Adding a WebAPI controller
To add a WebAPI controller in your existing Web Application, right-click the project in the solution explorer and select Add > New Item. In the Add New Item window, select WebAPI Controller Class and name it as “RelationalController.cs”, and then click Add.
Now, WebAPI controller is added to your application successfully which in-turn comprise of the following file. The utilization of this file will be explained in the immediate sections.
- RelationalController.cs
NOTE
While adding WebAPI Controller class, name it with the suffix “Controller” that is mandatory. For example, in demo the controller is named as “RelationalController”. Also, the above “GettingStarted.html” contains WebAPI URL, which is “/Relational”. If you are using the WCF service, then the URL will look like “RelationalService.svc”.
Remove all the existing methods such as “Get”, “Post”, “Put”, and “Delete” that are present inside the RelationalController.cs file.
namespace PivotGridDemo
{
    public class RelationalController: ApiController
    {

    }
}
List of dependency libraries
You can add the below mentioned dependency libraries to your Web Application. These libraries could be found in GAC (Global Assembly Cache).
To add them to your Web Application, right-click the References in the solution explorer and select Add Reference. Now, in the Reference Manager dialog, under Assemblies > Extension, the following Syncfusion libraries are found.
NOTE
If you have installed any version of Essential Studio, then the location of Syncfusion libraries is [system drive:\Program Files (x86)\Syncfusion\Essential Studio\28.1.33\Assemblies].
- Syncfusion.Compression.Base
- Syncfusion.Linq.Base
- Syncfusion.Olap.Base
- Syncfusion.PivotAnalysis.Base
- System.Data.SqlServerCe (Version: 4.0.0.0)
- Syncfusion.XlsIO.Base
- Syncfusion.Pdf.Base
- Syncfusion.DocIO.Base
- Syncfusion.EJ
- Syncfusion.EJ.Export
- Syncfusion.EJ.Pivot
List of namespaces
Following are the list of namespaces to be added on top of the main class inside the RelationalController.cs file.
using Syncfusion.JavaScript;
using Syncfusion.PivotAnalysis.Base;
using System;
using System.Collections.Generic;
using System.Data;
using System.Data.SqlServerCe;
using System.Linq;
using System.Text;
using System.Web;
using System.Web.Http;
using System.Web.Script.Serialization;
using OLAPUTILS = Syncfusion.JavaScript.Olap;

namespace PivotGridDemo
{
    public class RelationalController : ApiController
    {

    }
}
Datasource initialization
A simple collection is provided as a datasource for the PivotGrid in this demo section. This datasource is placed inside a separate class “ProductSales” in the RelationalController.cs file. Refer the following code example:
namespace PivotGridDemo
{
………
………
………
internal class ProductSales
    {
        public string Product { get; set; }

        public string Date { get; set; }

        public string Country { get; set; }

        public string State { get; set; }

        public int Quantity { get; set; }

        public double Amount { get; set; }

        public static ProductSalesCollection GetSalesData()
        {
            /// Geography
            string[] countries = new string[] { "Australia", "Canada", "France", "Germany", "United Kingdom", "United States" };
            string[] ausStates = new string[] { "New South Wales", "Queensland", "South Australia", "Tasmania", "Victoria" };
            string[] canadaStates = new string[] { "Alberta", "British Columbia", "Brunswick", "Manitoba", "Ontario", "Quebec" };
            string[] franceStates = new string[] { "Charente-Maritime", "Essonne", "Garonne (Haute)", "Gers", };
            string[] germanyStates = new string[] { "Bayern", "Brandenburg", "Hamburg", "Hessen", "Nordrhein-Westfalen", "Saarland" };
            string[] ukStates = new string[] { "England" };
            string[] ussStates = new string[] { "New York", "North Carolina", "Alabama", "California", "Colorado", "New Mexico", "South Carolina" };

            /// Time
            string[] dates = new string[] { "FY 2005", "FY 2006", "FY 2007", "FY 2008", "FY 2009" };

            /// Products
            string[] products = new string[] { "Bike", "Van", "Car" };
            Random r = new Random(123345345);

            int numberOfRecords = 2000;
            ProductSalesCollection listOfProductSales = new ProductSalesCollection();
            for (int i = 0; i < numberOfRecords; i++)
            {
                ProductSales sales = new ProductSales();
                sales.Country = countries[r.Next(1, countries.GetLength(0))];
                sales.Quantity = r.Next(1, 12);
                /// 1 percent discount for 1 quantity
                double discount = (30000 * sales.Quantity) * (double.Parse(sales.Quantity.ToString()) / 100);
                sales.Amount = (30000 * sales.Quantity) - discount;
                sales.Date = dates[r.Next(r.Next(dates.GetLength(0) + 1))];
                sales.Product = products[r.Next(r.Next(products.GetLength(0) + 1))];
                switch (sales.Product)
                {
                    case "Car":
                        {
                            sales.Date = "FY 2005";
                            break;
                        }
                }
                switch (sales.Country)
                {
                    case "Australia":
                        {
                            sales.State = ausStates[r.Next(ausStates.GetLength(0))];
                            break;
                        }
                    case "Canada":
                        {
                            sales.State = canadaStates[r.Next(canadaStates.GetLength(0))];
                            break;
                        }
                    case "France":
                        {
                            sales.State = franceStates[r.Next(franceStates.GetLength(0))];
                            break;
                        }
                    case "Germany":
                        {
                            sales.State = germanyStates[r.Next(germanyStates.GetLength(0))];
                            break;
                        }
                    case "United Kingdom":
                        {
                            sales.State = ukStates[r.Next(ukStates.GetLength(0))];
                            break;
                        }
                    case "United States":
                        {
                            sales.State = ussStates[r.Next(ussStates.GetLength(0))];
                            break;
                        }
                }
                listOfProductSales.Add(sales);
            }

            return listOfProductSales;
        }

        public override string ToString()
        {
            return string.Format("{0}-{1}-{2}", this.Country, this.State, this.Product);
        }

        public class ProductSalesCollection : List<ProductSales>
        {
        }
    }
}
Service methods in WebAPI controller
You should define the service methods inside the RelationalController class. To define, found the RelationalController.cs file, which is created while adding the WebAPI Controller class from the Visual Studio to your Web Application.
namespace PivotGridDemo
{
    public class RelationalController : ApiController
    {
        PivotGrid htmlHelper = new PivotGrid();
        JavaScriptSerializer serializer = new JavaScriptSerializer();
        Dictionary<string, object> dict = new Dictionary<string, object>();
        string conStringforDB = ""; //Enter appropriate connection string to connect database for saving and loading operation of reports

        [System.Web.Http.ActionName("InitializeGrid")]
        [System.Web.Http.HttpPost]
        public Dictionary<string, object> InitializeGrid(Dictionary<string, object> jsonResult)
        {
            htmlHelper.PivotReport = BindDefaultData();
            dict = htmlHelper.GetJsonData(jsonResult["action"].ToString(), ProductSales.GetSalesData());
            return dict;
        }

        [System.Web.Http.ActionName("FetchMembers")]
        [System.Web.Http.HttpPost]
        public Dictionary<string, object> FetchMembers(Dictionary<string, object> jsonResult)
        {
            htmlHelper.PopulateData(jsonResult["currentReport"].ToString());
            dict = htmlHelper.GetJsonData(jsonResult["action"].ToString(), ProductSales.GetSalesData(), jsonResult["headerTag"].ToString(), jsonResult["sortedHeaders"].ToString());
            return dict;
        }

        [System.Web.Http.ActionName("Filtering")]
        [System.Web.Http.HttpPost]
        public Dictionary<string, object> Filtering(Dictionary<string, object> jsonResult)
        {
            htmlHelper.PopulateData(jsonResult["currentReport"].ToString());
            dict = htmlHelper.GetJsonData(jsonResult["action"].ToString(), ProductSales.GetSalesData(), jsonResult["filterParams"].ToString(), jsonResult["sortedHeaders"].ToString());
            return dict;
        }

        [System.Web.Http.ActionName("NodeStateModified")]
        [System.Web.Http.HttpPost]
        public Dictionary<string, object> NodeStateModified(Dictionary<string, object> jsonResult)
        {
            htmlHelper.PopulateData(jsonResult["currentReport"].ToString());
            dict = htmlHelper.GetJsonData(jsonResult["action"].ToString(), ProductSales.GetSalesData(), jsonResult["headerTag"].ToString(), jsonResult["dropAxis"].ToString(), jsonResult["filterParams"].ToString(), jsonResult["sortedHeaders"].ToString());
            return dict;
        }

        [System.Web.Http.ActionName("NodeDropped")]
        [System.Web.Http.HttpPost]
        public Dictionary<string, object> NodeDropped(Dictionary<string, object> jsonResult)
        {
            htmlHelper.PopulateData(jsonResult["currentReport"].ToString());
            dict = htmlHelper.GetJsonData(jsonResult["action"].ToString(), ProductSales.GetSalesData(), jsonResult["dropAxis"].ToString(), jsonResult["headerTag"].ToString(), jsonResult.ContainsKey("filterParams") ? jsonResult["filterParams"].ToString() : null, jsonResult["sortedHeaders"].ToString());
            return dict;
        }

        [System.Web.Http.ActionName("Sorting")]
        [System.Web.Http.HttpPost]
        public Dictionary<string, object> Sorting(Dictionary<string, object> jsonResult)
        {
            htmlHelper.PopulateData(jsonResult["currentReport"].ToString());
            dict = htmlHelper.GetJsonData(jsonResult["action"].ToString(), ProductSales.GetSalesData(), jsonResult["sortedHeaders"].ToString());
            return dict;
        }

        [System.Web.Http.ActionName("CalculatedField")]
        [System.Web.Http.HttpPost]
        public Dictionary<string, object> CalculatedField(Dictionary<string, object> jsonResult)
        {
            htmlHelper.PopulateData(jsonResult["currentReport"].ToString());
            dict = htmlHelper.GetJsonData(jsonResult["action"].ToString(), ProductSales.GetSalesData(), null, jsonResult["headerTag"].ToString());
            return dict;
        }

        [System.Web.Http.ActionName("Export")]
        [System.Web.Http.HttpPost]
        public void Export()
        {
            string args = HttpContext.Current.Request.Form.GetValues(0)[0];
            Dictionary<string, string> gridParams = serializer.Deserialize<Dictionary<string, string>>(args);
            htmlHelper.PopulateData(gridParams["currentReport"]);
            string fileName = "Sample";
            htmlHelper.ExportPivotGrid(ProductSales.GetSalesData(), args, fileName, System.Web.HttpContext.Current.Response);
        }

        [System.Web.Http.ActionName("SaveReport")]
        [System.Web.Http.HttpPost]
        public Dictionary<string, object> SaveReport(Dictionary<string, object> jsonResult)
        {
            string mode = jsonResult["operationalMode"].ToString();
            bool isDuplicate = true;
            SqlCeConnection con = new SqlCeConnection() { ConnectionString = conStringforDB };
            con.Open();
            SqlCeCommand cmd1 = null;
            foreach (DataRow row in GetDataTable().Rows)
            {
                if ((row.ItemArray[0] as string).Equals(jsonResult["reportName"].ToString()))
                {
                    isDuplicate = false;
                    cmd1 = new SqlCeCommand("update ReportsTable set Report=@Reports where ReportName like @ReportName", con);
                }
            }
            if (isDuplicate)
            {
                cmd1 = new SqlCeCommand("insert into ReportsTable Values(@ReportName,@Reports)", con);
            }
            cmd1.Parameters.Add("@ReportName", jsonResult["reportName"].ToString());
            if (mode == "serverMode")
                cmd1.Parameters.Add("@Reports", OLAPUTILS.Utils.GetReportStream(jsonResult["clientReports"].ToString()).ToArray());
            else if (mode == "clientMode")
                cmd1.Parameters.Add("@Reports", Encoding.UTF8.GetBytes(jsonResult["clientReports"].ToString()).ToArray());
            cmd1.ExecuteNonQuery();
            con.Close();
            return null;
        }

        [System.Web.Http.ActionName("LoadReportFromDB")]
        [System.Web.Http.HttpPost]
        public Dictionary<string, object> LoadReportFromDB(Dictionary<string, object> jsonResult)
        {
            byte[] reportString = new byte[2 * 1024];
            PivotReport report = new PivotReport();
            var reports = "";
            string mode = jsonResult["operationalMode"].ToString();
            Dictionary<string, object> dictionary = new Dictionary<string, object>();
            if (mode == "serverMode" && jsonResult.ContainsKey("clientReports"))
            {
                reports = jsonResult["clientReports"].ToString();
            }
            else
            {
                foreach (DataRow row in GetDataTable().Rows)
                {
                    if ((row.ItemArray[0] as string).Equals(jsonResult["reportName"].ToString()))
                    {
                        if (mode == "clientMode")
                        {
                            reportString = (row.ItemArray[1] as byte[]);
                            dictionary.Add("report", Encoding.UTF8.GetString(reportString));
                            break;
                        }
                        else if (mode == "serverMode")
                        {
                            reports = OLAPUTILS.Utils.CompressData(row.ItemArray[1] as byte[]);
                            break;
                        }
                    }
                }
            }
            if (reports != "")
            {
                report = htmlHelper.DeserializedReports(reports);
                htmlHelper.PivotReport = report;
                dictionary = htmlHelper.GetJsonData("loadOperation", ProductSales.GetSalesData(), "Load Report", jsonResult["reportName"].ToString());
            }
            return dictionary;
        }

        private DataTable GetDataTable()
        {
            SqlCeConnection con = new SqlCeConnection() { ConnectionString = conStringforDB };
            con.Open();
            DataSet dSet = new DataSet();
            new SqlCeDataAdapter("Select * from ReportsTable", con).Fill(dSet);
            con.Close();
            return dSet.Tables[0];
        }

        [System.Web.Http.ActionName("DeferUpdate")]
        [System.Web.Http.HttpPost]
        public Dictionary<string, object> DeferUpdate(Dictionary<string, object> jsonResult)
        {
            htmlHelper.PopulateData(jsonResult["currentReport"].ToString());
            dict = htmlHelper.GetJsonData(jsonResult["action"].ToString(), ProductSales.GetSalesData(), null, null, null, jsonResult["sortedHeaders"].ToString(), jsonResult["filterParams"].ToString());
            return dict;
        }

        [System.Web.Http.ActionName("CellEditing")]
        [System.Web.Http.HttpPost]
        public Dictionary<string, object> CellEditing(Dictionary<string, object> jsonResult)
        {
            htmlHelper.PopulateData(jsonResult["currentReport"].ToString());
            dict = htmlHelper.GetJsonData(jsonResult["action"].ToString(), ProductSales.GetSalesData(), jsonResult["index"].ToString(), jsonResult["summaryValues"].ToString(), jsonResult["valueHeaders"].ToString());
            return dict;
        }

        private PivotReport BindDefaultData()
        {
            PivotReport pivotSetting = new PivotReport();
            pivotSetting.PivotRows.Add(new PivotItem { FieldMappingName = "Product", FieldHeader = "Product", TotalHeader = "Total" });
            pivotSetting.PivotColumns.Add(new PivotItem { FieldMappingName = "Country", FieldHeader = "Country", TotalHeader = "Total" });
            pivotSetting.PivotCalculations.Add(new PivotComputationInfo { CalculationName = "Amount", Description = "Amount", FieldHeader = "Amount", FieldName = "Amount", Format = "C", SummaryType = Syncfusion.PivotAnalysis.Base.SummaryType.DoubleTotalSum });
            return pivotSetting;
        }
    }
        .....
        ..... // Initialize the datasource
        .....
}
Configure routing in global application class
To add a Global.asax in your existing Web Application, right-click the project in the solution explorer and select Add > New item. In the Add New Item window, select Global Application class and name it as “Global.asax”, and then click Add.
After adding the Global.asax file, immediately add the namespace “using System.Web.Http;”, and then you can configure the routing as shown in the following code example.
public class Global : System.Web.HttpApplication
    {
        protected void Application_Start(object sender, EventArgs e)
        {
            System.Web.Http.GlobalConfiguration.Configuration.Routes.MapHttpRoute(
                name: "DefaultApi",
                routeTemplate: "{controller}/{action}/{id}",
                defaults: new { id = RouteParameter.Optional });
            AppDomain.CurrentDomain.SetData("SQLServerCompactEditionUnderWebHosting", true);
        }
}
Now, PivotGrid is rendered with sales amount over a set of products across different customer geographic locations.
NOTE
Here,
customObjectis utilized to pass additional information between the client-end and the service-end.
WCF
This section demonstrates the utilization of WCF service as endpoint binding relational datasource to a simple PivotGrid. For more details on this topic, click here.