Getting Started with ASP.NET Webforms Chart
3 Oct 202312 minutes to read
This section explains you on how to create a simple Chart in your application with ASP.NET and covers only the minimal features that you need to know to get started with the Chart.
Installation and Deployment
It describes you on how to configure the Syncfusion dependencies in your ASP.NET application to create a Chart.
Referencing Syncfusion Assemblies
The following assemblies need to be referenced in your application for using Essential Chart ASP
- Syncfusion.EJ.dll
- Syncfusion.EJ.Web.dll
Follow the steps given below to deploy the application in the development server by referencing the assembly in GAC.
- Web.config file should be configured according to the referenced assemblies.
- To deploy your application, you have to ensure that the above referenced assemblies (in your web.config files) are present in the GAC.
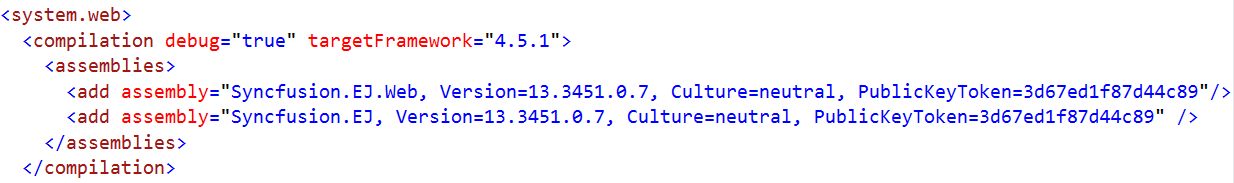
And, add the Syncfusion namespace in the Web.config file.
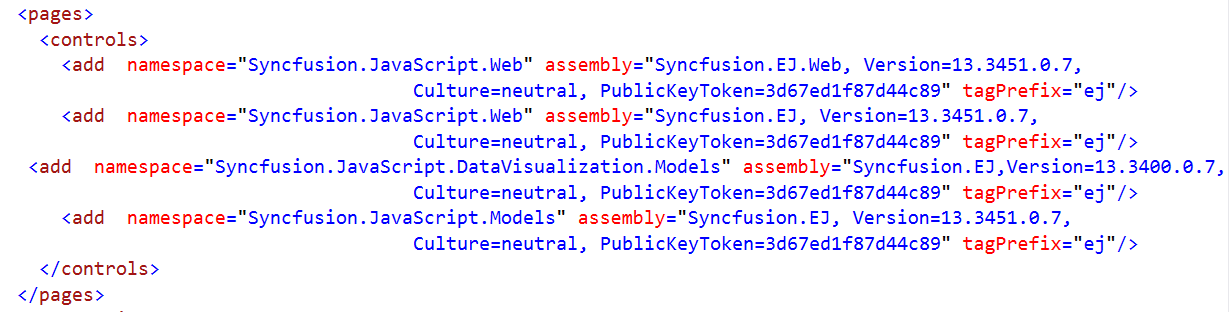
NOTE
If you are referring Syncfusion assemblies manually from bin folder to create ASP Chart, then remove Culture, Version and PublicKeyToken attributes used in all, and nodes.
Adding script reference
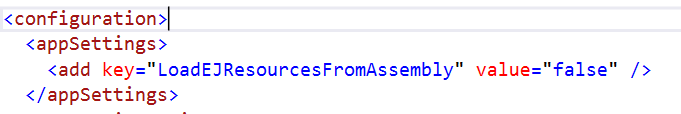
By default, Syncfusion JavaScript source files has been included into the EJ.Web assembly as an embedded source. So we no need to refer jQuery and Syncfusion scripts externally. For debugging purpose want to refer script files externally, set false to LoadEJResourcesFromAssembly in Web.config file as shows in the below image and refer jQuery and Syncfusion script files.
<!--  jquery script  -->
    <script src="http://cdn.syncfusion.com/js/assets/external/jquery-1.10.2.min.js"></script>

    <!-- Essential JS UI widget -->
    <script src="http://cdn.syncfusion.com/24.2.3/js/web/ej.web.all.min.js"></script>
NOTE
If you are using the Essential Studio below 13.4.0.53 version, then you need to refer jQuery.globalize.js script file along with the above references to render the Chart control.
Initialize chart
Add the following code in the default.aspx file to create the Chart control in View page.
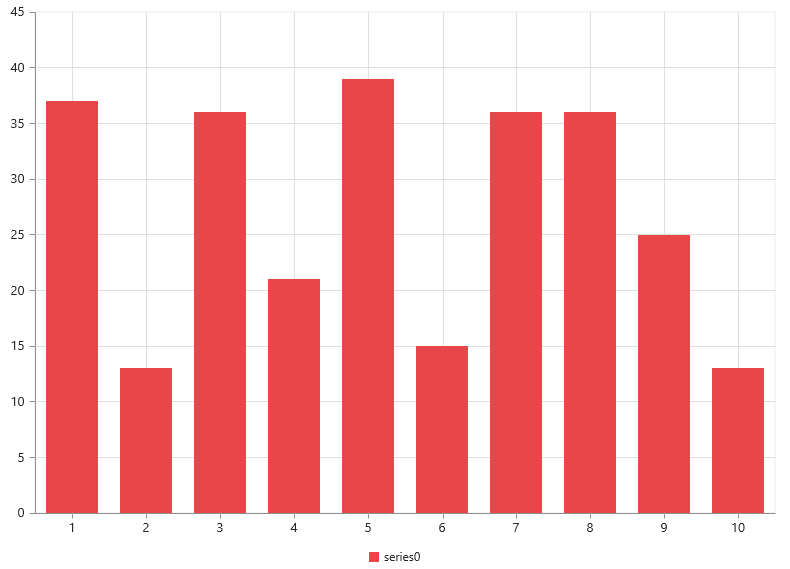
<ej:Chart ID="Chart1" runat="server" >
 </ej:Chart>
Now, the Chart is rendered with some auto-generated random values and with default Column chart type.
Initialize the chart by using the ejChart method. The chart is rendered to the size of its container, by default. You can also customize the chart dimension either by setting the width and height of the container element as in the above code example or by using the Size option of the Chart. Refer to the Chart Dimensions to know more about setting the size of the chart.
Populate chart with data
Now, let’s see how to plot data source to the Chart. First, let us generate a data source containing following fields in controller– Month and Sales.
public partial class _Default : Page
    {
        protected void Page_Load(object sender, EventArgs e)
        {
   // Create dataSource to chart
            List<ChartData> data = new List<ChartData>();
            data.Add(new ChartData("Jan", 35));
            data.Add(new ChartData("Feb", 28));
            data.Add(new ChartData("Mar", 34));
            data.Add(new ChartData("Apr", 32));
            data.Add(new ChartData("May", 40));
            data.Add(new ChartData("Jun", 32));
            data.Add(new ChartData("Jul", 35));
            data.Add(new ChartData("Aug", 55));
            data.Add(new ChartData("Sep", 38));
            data.Add(new ChartData("Oct", 30));
            data.Add(new ChartData("Nov", 25));
            data.Add(new ChartData("Dec", 32));
            this.Chart1.DataSource = data;
            this.DataBind();
       }
   }
    public class ChartData {
        public string Month;
        public double Sales;
        public ChartData(string month, double sales)
        {
            this.Month = month;
            this.Sales = sales;
        }
    }
Add a Series object to the chart using Series option and set the chart type as Line using Type option.
<ej:Chart ID="Chart1" runat="server" >
           <Series>
               <ej:Series Type="Line"></ej:Series>
           </Series>
</ej:Chart>
You can also add multiple series objects based on your requirement. Refer Chart Types and Chart Series sections to know more about chart types, how to add multiple series and customize series appearance.
Next, map the Month and Sales values in the data source to the Line series by setting XName and YName with the field names respectively, and then set the actual data using DataSource option. Refer Data Binding section to know more about binding local and remote data to the chart.
<ej:Chart ID="Chart1" runat="server">
           <Series>
               <ej:Series Type="Line" XName="Month" YName="Sales"></ej:Series>
           </Series>
</ej:Chart>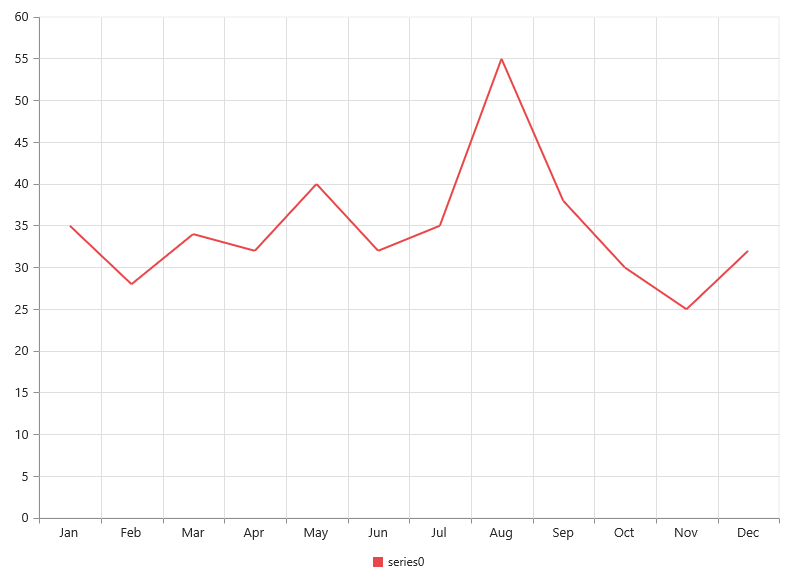
Since the data is related to Sales, format the vertical axis labels by adding ‘$’ as a prefix and ‘K’ as a suffix to each label. This can be achieved by setting the “${value}K” to the LabelFormat option of the axis. Here, {value} acts as a placeholder for each axis label, “$” and “K” are the actual prefix and suffix added to each axis label.
The following code example illustrates this,
<ej:Chart ID="Chart1" runat="server">

    <PrimaryYAxis LabelFormat="${value}K">
    </PrimaryYAxis>

</ej:Chart>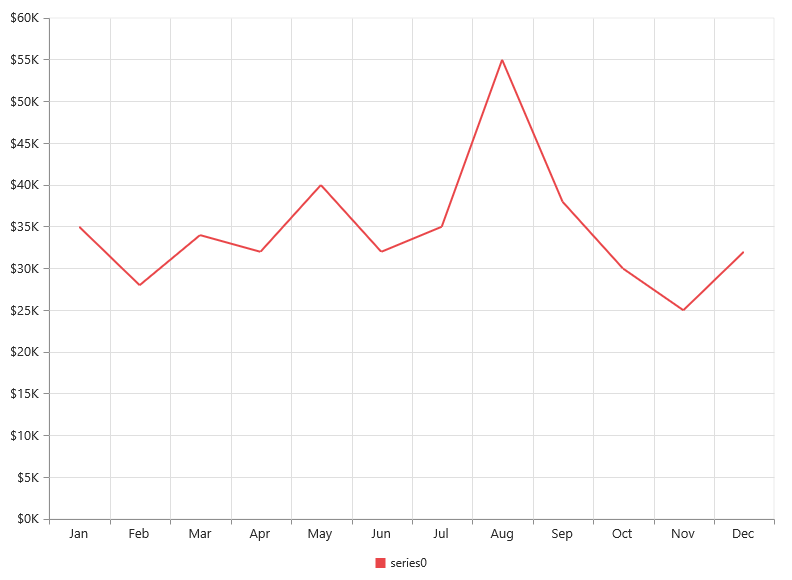
Refer Axis section to know more about axis types, adding multiple axes and other customization options.
Add Data Labels
You can add data labels to improve the readability of the chart. This can be achieved by enabling the Visible option in the DataLabel option. Now, the data labels are rendered at the top of all the data points.
The following code example illustrates this,
<ej:Chart ID="Chart1" runat="server">
            <Series>
                <ej:Series>
                    <Marker>
                        <DataLabel Visible="true"> </DataLabel>
                    </Marker>
                </ej:Series>
            </Series>
        </ej:Chart>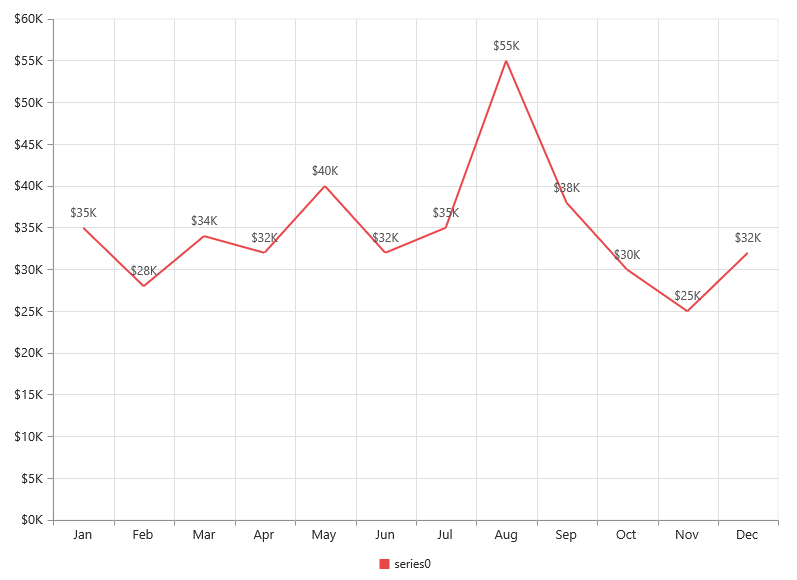
There are situations where the default label content is not sufficient to the user. In this case, you can use the Template option to format the label content with some additional information.
<!DOCTYPE html>
<html>
<body>
      <div id="dataLabelTemplate" style="display:none; padding:3px;background-color:#B9C5C9; opacity:0.8;">
         <div id="point">#point.x#:$#point.y#K</div>
      </div>
</body>
</html>
The above HTML template is used as a template for each data label. Here, “point.x” and “point.y” are the placeholder text used to display the corresponding data point’s x & y value.
The following code example shows how to set the id of the above template to Template option,
<ej:Chart ID="Chart1" runat="server">
            <Series>
                <ej:Series>
                    <Marker>
                        <DataLabel Visible="true" Template="dataLabelTemplate">
                        </DataLabel>
                    </Marker>
                </ej:Series>
            </Series>
        </ej:Chart>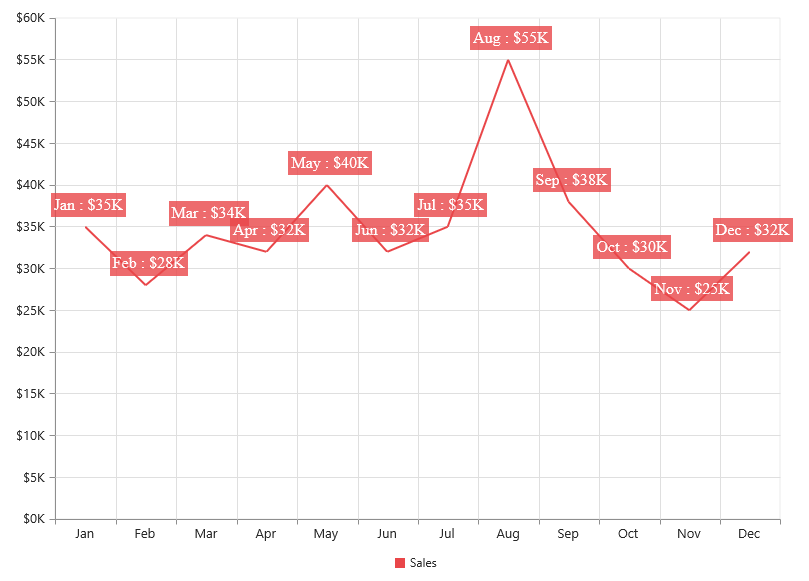
Refer to the Data Markers section to know more about the options available to customize it.
Enable Legend
You can enable or disable the legend by using the Visible option in the Legend. It is enabled in the chart, by default.
<ej:Chart ID="Chart1" runat="server">
            <Series>
                <ej:Series Name="Sales">
                </ej:Series>
            </Series>
            <Legend Visible="true"></Legend>
        </ej:Chart>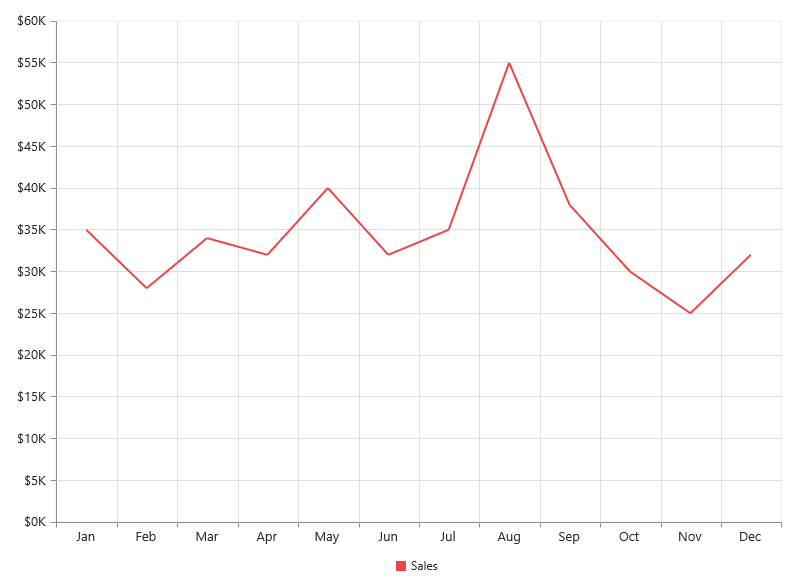
Refer to the Legend section to know more about how to position legend and customize its appearance.
Enable Tooltip
The Tooltip is useful when you cannot display information by using the DataLabels due to the space constraints. You can enable tooltip by using the Visible option of the Tooltip in the specific series.
The following code example illustrates this,
<ej:Chart ID="Chart1" runat="server">
            <Series>
                <ej:Series>
                    <Tooltip Visible="true"></Tooltip>
                </ej:Series>
            </Series>
        </ej:Chart>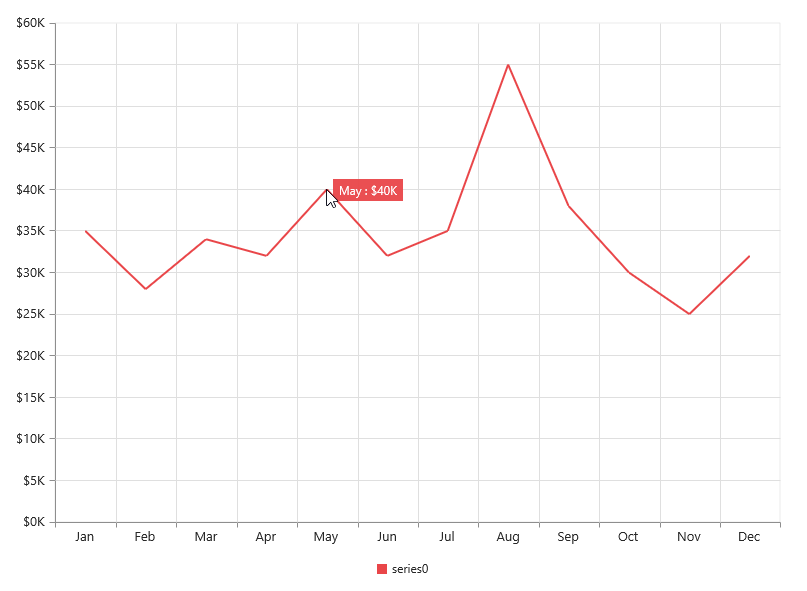
Refer to the Tooltip section to know more about formatting tooltip contents and customizing its appearance.
Add Chart Title
You need to add a title to the chart to provide quick information to the user about the data being plotted in the chart. You can add it by using the Text option of the Title.
<ej:Chart ID="Chart1" runat="server">
           <Title Text="Sales Analysis"></Title>
      </ej:Chart>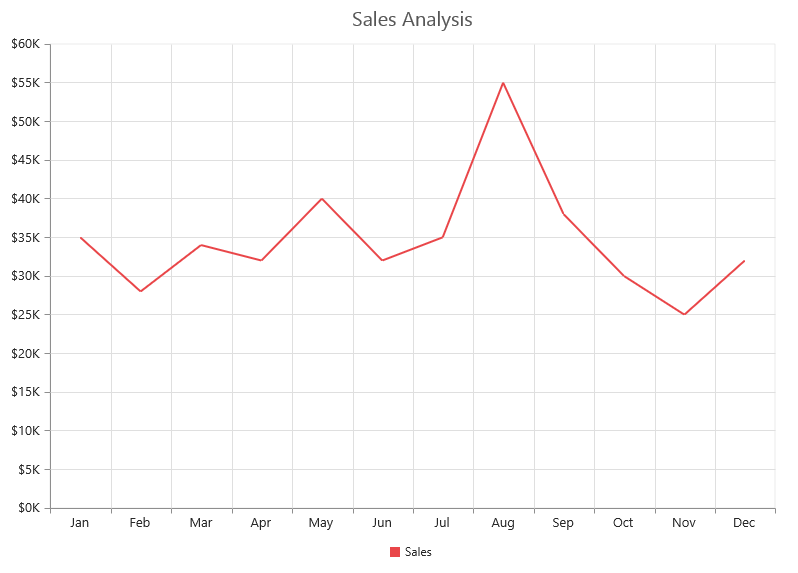
Refer to the Chart Title section to know more about aligning Title, customizing its appearance and adding SubTitle to the chart.
We have created a sample by combining all the above code snippets for reference. This can be downloaded here.