Chart Series
1 Apr 20168 minutes to read
Multiple Series
In EjChart, you can add multiple series object in the Series options. The series are rendered in the order it is added to the Series option, by default. You can change this order by using the ZOrder option.
<ej:Chart ID="Chart1" runat="server">
    <%--Adding Multiple Series  --%>
    <Series>
        <%--Add first series--%>
        <ej:Series Type="Column">
            <Points>
                <ej:Points X="USA" Y="50"></ej:Points>
                <%--...--%>
            </Points>
        </ej:Series>
        <%--Add second series--%>
        <ej:Series Type="Column">
            <Points>
                <ej:Points X="USA" Y="70"></ej:Points>
                <%--...--%>
            </Points>
        </ej:Series>
        <%--Add third series--%>
        <ej:Series Type="Column">
            <Points>
                <ej:Points X="USA" Y="45"></ej:Points>
                <%--...--%>
            </Points>
        </ej:Series>
    </Series>
</ej:Chart>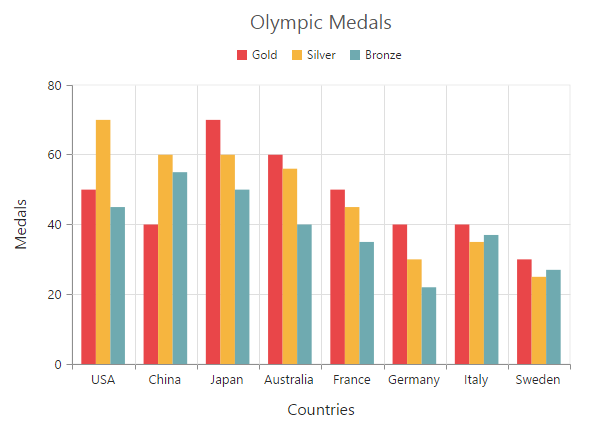
Click here to view the multiple series online demo sample.
Customizing all series together
By using the CommonSeriesOptions, you can customize the series options for all the series commonly, instead of setting the options directly on each series object.
NOTE
The inline properties of the series has the first priority and override the commonSeriesOptions.
The following code example explains on how to enable marker, tooltip and animation for the chart series by using the commonSeriesOptions.
<ej:Chart ID="Chart1" runat="server">

    <%--Initializing Common Properties for all the series--%>
    <CommonSeriesOptions Type="Line" EnableAnimation="true">
        <Border Width="2" />
        <Marker Visible="true" Shape="Circle">
            <Size Height="10" Width="10"/>
        </Marker>
        <Tooltip Visible="true" Template="Tooltip"></Tooltip>
    </CommonSeriesOptions>

    <%--Adding Multiple Series  --%>
    <Series>
        <%--Add first series--%>
        <ej:Series>
            <Points>
                <ej:Points X="USA" Y="50"></ej:Points>
                <%--...--%>
            </Points>
        </ej:Series>
        <%--Add second series--%>
        <ej:Series>
            <Points>
                <ej:Points X="USA" Y="70"></ej:Points>
                <%--...--%>
            </Points>
        </ej:Series>
        <%--Add third series--%>
        <ej:Series>
            <Points>
                <ej:Points X="USA" Y="45"></ej:Points>
                <%--...--%>
            </Points>
        </ej:Series>
    </Series>
</ej:Chart>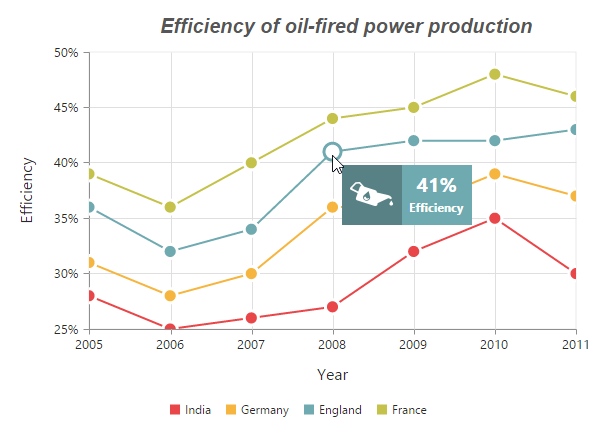
Combination Series
EjChart allows you to render the combination of different series in the chart.
<ej:Chart ID="Chart1" runat="server">

    <%--Adding Multiple Series  --%>
    <Series>
        <%--Add first series--%>
        <ej:Series Type="Column">
            <Points>
                <ej:Points X="USA" Y="50"></ej:Points>
                <%--...--%>
            </Points>
        </ej:Series>
        <%--Add second series--%>
        <ej:Series Type="Line">
            <Points>
                <ej:Points X="USA" Y="70"></ej:Points>
                <%--...--%>
            </Points>
        </ej:Series>
    </Series>
</ej:Chart>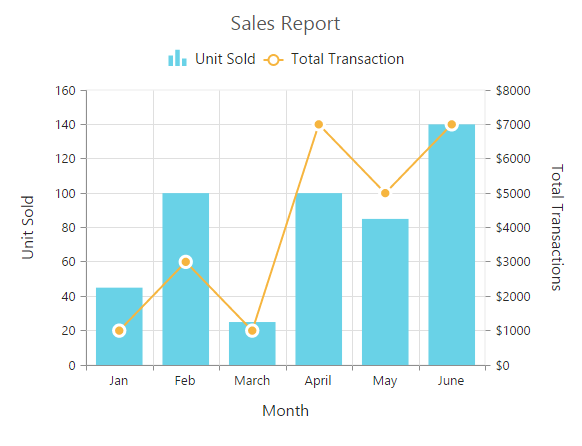
Click here to view the combination series online demo sample.
Limitation of combination chart
-
Bar, StackingBar, and StackingBar100 cannot be combined with the other Cartesian type series.
-
Cartesian type series cannot be combined with the accumulation series Pie, Doughnut, Funnel, and Pyramid.
-
Polar and Radar series cannot be combined with the accumulation and Cartesian type series.
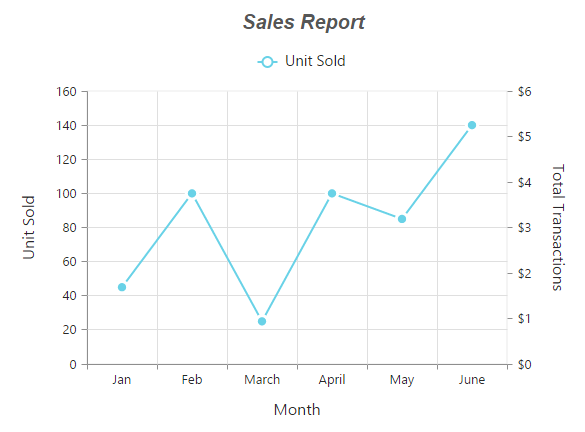
When the combination of Cartesian and accumulation series types are added to the series option, the series that are similar to the first series are rendered and other series are ignored. The following code example illustrates this,
<ej:Chart ID="Chart1" runat="server">

    <%--Adding Multiple Series  --%>
    <Series>
        <%--Add Line series--%>
        <ej:Series Type="Line">
            <Points>
                <ej:Points X="USA" Y="50"></ej:Points>
                <%--...--%>
            </Points>
        </ej:Series>
        <%--Add Pie series--%>
        <ej:Series Type="Pie">
            <Points>
                <ej:Points X="USA" Y="70"></ej:Points>
                <%--...--%>
            </Points>
        </ej:Series>
    </Series>
</ej:Chart>