Getting Started with Windows Forms Chart
11 Oct 202214 minutes to read
This section provides the details that you will need to know about getting started with our WinForms Chart control.
Assembly deployment
Refer control dependencies section to get the list of assemblies or NuGet package needs to be added as reference to use the control in any application.
Please find more details regarding how to install the nuget packages in windows form application in the below link:
Adding chart to form
To add chart to your form, follow the given steps:
1.Open your form in designer. Add the Syncfusion controls to your VS.NET toolbox if you have not done it already (the install would have automatically done this unless you selected not to complete toolbox integration during installation).
2.Drag the ChartControl and drop into the form.
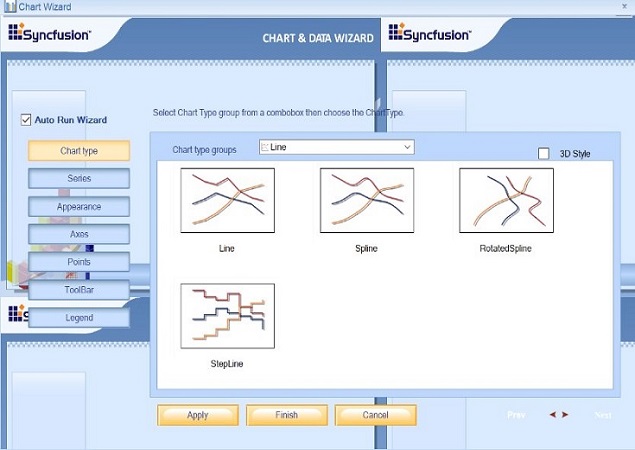
3.After dropping the chart, the ChartWizard will be opened. You can set up the chart configuration during design-time.
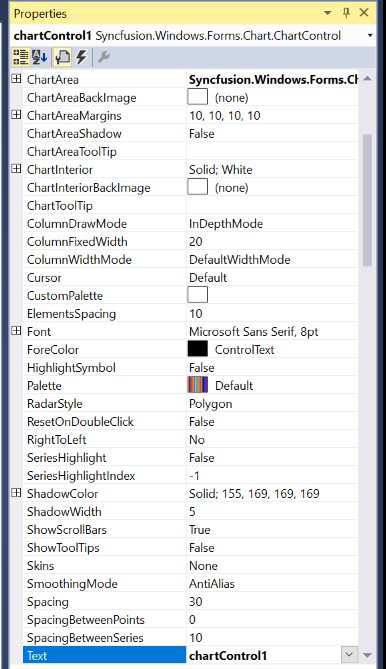
4.Appearance and behavior-related aspects of chart can be controlled by setting the appropriate properties using the properties grid.
For example, change the position of the legend to be aligned at the top by changing the LegendPosition property.
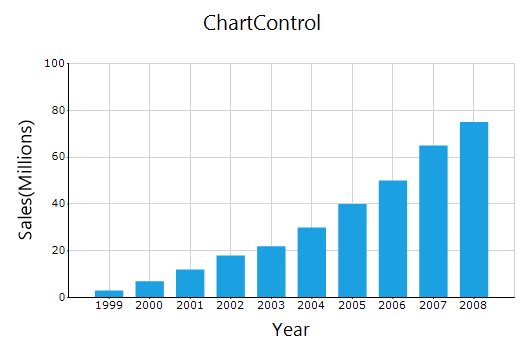
Populate chart with data
In this section, the comparison of sales of a product has been visualized by using the BindingList.
-
Now, define a simple data model that represents a data point and create a data model class like as follows.
public class SalesData
{
    private string year;

    private double sales;

    public string Year
    {
        get { return year; }

        set { year = value; }
    }
    public double Sales
    {
        get { return sales; }

        set { sales = value; }
    }

    public SalesData(string year, double sales)
    {
        this.Year = year;

        this.Sales = sales;
    }
}
Public Class SalesData Private xValue As String Private yValue As Double Public Property Year As String Get Return xValue End Get Set(ByVal value As String) xValue = value End Set End Property Public Property Sales As Double Get Return yValue End Get Set(ByVal value As Double) yValue = value End Set End Property Public Sub New(ByVal year As String, ByVal sales As Double) Me.Year = year Me.Sales = sales End Sub End Class -
Create an instance for BindingList to add list of data model.
BindingList<SalesData> dataSource = new BindingList<SalesData>();

dataSource.Add(new SalesData("1999", 3));

dataSource.Add(new SalesData("2000", 7));

dataSource.Add(new SalesData("2001", 12));

dataSource.Add(new SalesData("2002", 18));

dataSource.Add(new SalesData("2003", 22));

dataSource.Add(new SalesData("2004", 30));

dataSource.Add(new SalesData("2005", 40));

dataSource.Add(new SalesData("2006", 50));

dataSource.Add(new SalesData("2007", 65));

dataSource.Add(new SalesData("2008", 75));
Dim dataSource As BindingList(Of SalesData) = New BindingList(Of SalesData) dataSource.Add(New SalesData("1999", 3)) dataSource.Add(New SalesData("2000", 7)) dataSource.Add(New SalesData("2001", 12)) dataSource.Add(New SalesData("2002", 18)) dataSource.Add(New SalesData("2003", 22)) dataSource.Add(New SalesData("2004", 30)) dataSource.Add(New SalesData("2005", 40)) dataSource.Add(New SalesData("2006", 50)) dataSource.Add(New SalesData("2007", 65)) dataSource.Add(New SalesData("2008", 75)) -
Create an instance of CategoryAxisDataBindModel and bind the XValues and YValues to CategoryName and YNames properties, respectively as follows.
CategoryAxisDataBindModel dataSeriesModel = new CategoryAxisDataBindModel(dataSource);

dataSeriesModel.CategoryName = "Year";

dataSeriesModel.YNames = new string[] { "Sales" };
Dim dataSeriesModel As CategoryAxisDataBindModel = New CategoryAxisDataBindModel(dataSource) dataSeriesModel.CategoryName = "Year" dataSeriesModel.YNames = New String() {"Sales"} -
Create a ChartSeries to bind the above data bind model to CategoryModel and add it to the ChartControl.
ChartSeries chartSeries = new ChartSeries("Sales");

chartSeries.CategoryModel = dataSeriesModel;
Dim chartSeries As ChartSeries = New ChartSeries("Sales") chartSeries.CategoryModel = dataSeriesModel -
To use categorical data, set the ValueType property of PrimaryXAxis to Category.
this.chartControl1.PrimaryXAxis.ValueType = ChartValueType.Category;Me.chartControl1.PrimaryXAxis.ValueType = ChartValueType.Category
Apply skins to ChartControl
To improve the appearance of chart, apply Metro skin to ChartControl as follows.
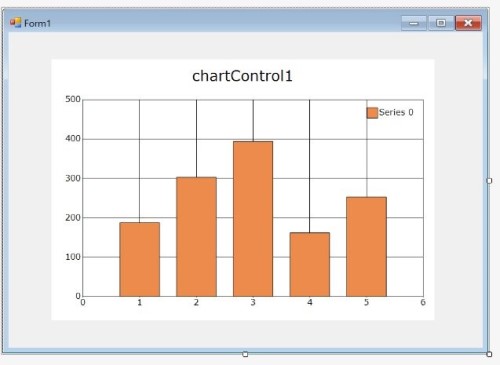
this.chartControl1.Skins = Skins.Metro;Me.chartControl1.Skins = Skins.MetroThe following screenshot depicts the view when you run the project in your form.
Add chart title
Title is added to chart to provide quick information to users about the data being plotted in the chart. You can add title to chart by using the Text property of ChartTitle.
ChartTitle title = new ChartTitle();

title.Text = "Product Sales";

this.chartControl1.Titles.Add(title);
Dim title As ChartTitle = New ChartTitle("Sales")
title.Text = "Product Sales"
Me.chartControl1.Titles.Add(title);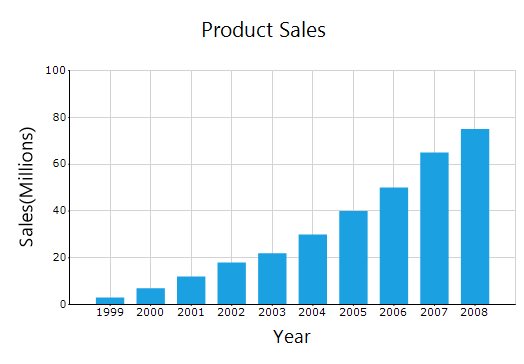
Enable legend
The Legend is enabled or disabled by using the Visible property. The legend is enabled in chart, by default.
ChartSeries chartSeries = new ChartSeries("Sales");

this.chartControl1.Legend.Visible = true;

this.chartControl1.LegendAlignment = ChartAlignment.Center;

this.chartControl1.Legend.Position = ChartDock.Top;

this.chartControl1.LegendsPlacement = ChartPlacement.Outside;
Dim chartSeries As ChartSeries = New ChartSeries("Sales")
Me.chartControl1.Legend.Visible = true
Me.chartControl1.LegendAlignment = ChartAlignment.Center
Me.chartControl1.Legend.Position = ChartDock.Top
Me.chartControl1.LegendsPlacement = ChartPlacement.Outside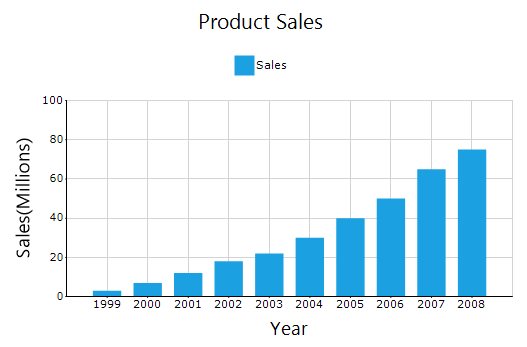
Enable data labels
You can add data labels to chart to improve readability by enabling the DisplayText property of Style in ChartSeries.
chartSeries.Style.DisplayText = true;

chartSeries.Style.TextOrientation = ChartTextOrientation.Up;chartSeries.Style.DisplayText = true
chartSeries.Style.TextOrientation = ChartTextOrientation.Up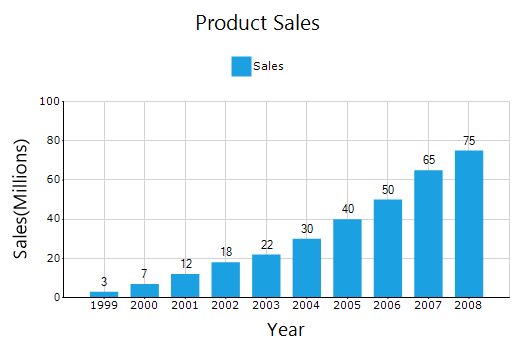
Enable tooltip
The Tooltip is used to show detailed information about a data point. Using data labels to show detailed information is not pleasant due to space constraints. You can enable tooltip by using the ShowToolTips property.
this.chartControl1.ShowToolTips = true;

this.chartControl1.Tooltip.BackgroundColor = new BrushInfo(Color.White);

this.chartControl1.Tooltip.BorderStyle = BorderStyle.FixedSingle;

this.chartControl1.Tooltip.Font = new Font("Segoe UI", 10);

chartSeries.PrepareStyle += ChartSeries_PrepareStyle;

private void ChartSeries_PrepareStyle(object sender, ChartPrepareStyleInfoEventArgs args)
{
     ChartSeries series = sender as ChartSeries;

     int index = args.Index;

     ChartPoint point = series.Points[index];

     args.Style.ToolTip = "Product : " + point.Category + "\nSales : " + point.YValues[0];

	 args.Handled = true;
}Me.chartControl1.ShowToolTips = true
Me.chartControl1.Tooltip.BackgroundColor = New BrushInfo(Color.White)
Me.chartControl1.Tooltip.BorderStyle = BorderStyle.FixedSingle
Me.chartControl1.Tooltip.Font = New Font("Segoe UI", 10)
chartSeries.PrepareStyle = (chartSeries1.PrepareStyle + ChartSeries_PrepareStyle)
Private Sub ChartSeries_PrepareStyle(ByVal sender As Object, ByVal args As ChartPrepareStyleInfoEventArgs)
Dim series As ChartSeries = CType(sender,ChartSeries)
Dim index As Integer = args.Index
Dim point As ChartPoint = series.Points(index)
args.Style.ToolTip = ("Product : " _ + (point.Category + (""& vbLf&"Sales : " + point.YValues(0))))
args.Handled = true;
End Sub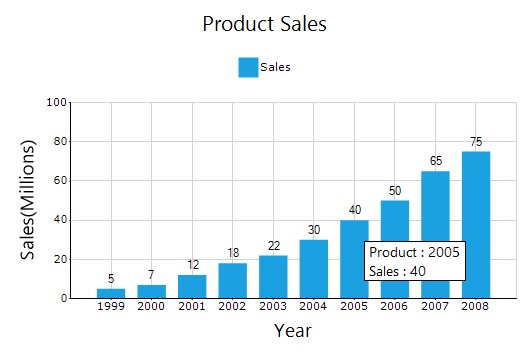
See Also
Binding a DataSet to a Chart, Tasks Window
You can find the complete getting started sample from this link.
NOTE
You can also explore our WinForms Chart example that shows how to render various chart types as well as how to easily configure with built-in support for creating stunning visual effects.