Getting Started with UWP Sunburst Chart (SfSunburstChart)
25 May 202114 minutes to read
This section explains you the steps required to populate the sunburst chart with data, add data labels, legends and header. This section covers only the minimal features that you need to know to get started with the Sunburst chart.
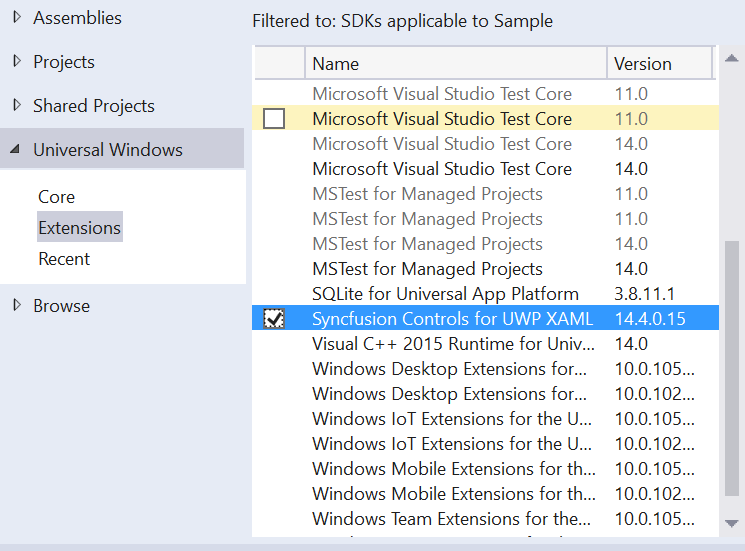
Adding assembly reference
- Open the Add Reference window from your project
- Choose Assemblies > Extensions > Syncfusion Controls for UWP XAML
NOTE
This window differs for the Visual Basic project.
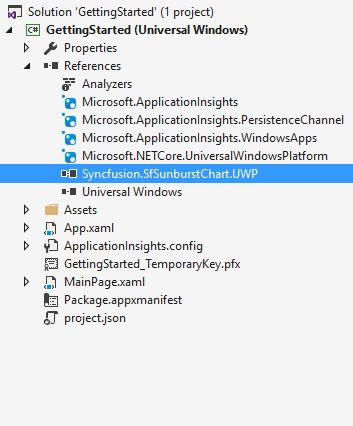
Adding SfSunburstChart from Toolbox
Drag and drop the SfSunburstChart control from the Toolbox to your application,

Now the Syncfusion.SfSunburstChart.UWP reference is added to the application references and the namespace code is generated in MainWindow.xaml as below.
Initialize view model
In this section, the data in the following table is used for demonstration,
| Country | Job Description | Job Group | Job Role | Employees Count |
|---|---|---|---|---|
| America | Sales | 70 | ||
| America | Technical | Testers | 35 | |
| America | Technical | Developers | Windows | 105 |
| America | Technical | Developers | Web | 40 |
| America | Management | 40 | ||
| America | Accounts | 60 | ||
| India | Technical | Testers | 25 | |
| India | Technical | Developers | Windows | 155 |
| India | Technical | Developers | Web | 60 |
| Germany | Sales | Executive | 30 | |
| Germany | Sales | Analyst | 40 | |
| UK | Technical | Developers | Windows | 100 |
| UK | Technical | Developers | Web | 30 |
| UK | HR Executives | 60 | ||
| UK | Marketing | 40 |
Now, let us define a data model that represents the above data in sunburst chart.
public class Model
    {
        public string Category { get; set; }
        public string Country { get; set; }
        public string JobDescription { get; set; }
        public string JobGroup { get; set; }
        public string JobRole { get; set; }
        public double EmployeesCount { get; set; }
    }
Next, create a view model class and initialize a list of Model objects as shown below,
public class ViewModel
     {
        public ObservableCollection<Model> Data { get; set; }
        public ViewModel()
        {
            Data = new ObservableCollection<Model>
            {
                new Model
                {
                    Country = "America", JobDescription = "Sales",
                    EmployeesCount = 70
                },
                new Model
                {
                    Country = "America", JobDescription = "Technical",
                    JobGroup = "Testers", EmployeesCount = 35
                },
                new Model
                {
                    Country = "America", JobDescription = "Technical",
                    JobGroup = "Developers", JobRole = "Windows", EmployeesCount = 105
                },
                new Model
                {
                    Country = "America", JobDescription = "Technical",
                    JobGroup = "Developers", JobRole = "Web", EmployeesCount = 40
                },
                new Model
                {
                    Country = "America", JobDescription = "Management",
                    EmployeesCount = 40
                },
                new Model
                {
                    Country = "America", JobDescription = "Accounts",
                    EmployeesCount = 60
                },
                new Model
                {
                    Country = "India", JobDescription = "Technical",
                    JobGroup = "Testers", EmployeesCount = 25
                },
                new Model
                {
                    Country = "India", JobDescription = "Technical", JobGroup = "Developers",
                    JobRole = "Windows", EmployeesCount = 155
                },
                new Model
                {
                    Country = "India", JobDescription = "Technical", JobGroup = "Developers",
                    JobRole = "Web", EmployeesCount = 60
                },
                new Model
                {
                    Country = "Germany", JobDescription = "Sales", JobGroup = "Executive",
                    EmployeesCount = 30
                },
                new Model
                {
                    Country = "Germany", JobDescription = "Sales", JobGroup = "Analyst",
                    EmployeesCount = 40
                },
                new Model
                {
                    Country = "UK", JobDescription = "Technical", JobGroup = "Developers",
                    JobRole = "Windows", EmployeesCount = 100
                },
                new Model
                {
                    Country = "UK", JobDescription = "Technical", JobGroup = "Developers",
                    JobRole = "Web", EmployeesCount = 30
                },
                new Model
                {
                    Country = "UK", JobDescription = "HR Executives", EmployeesCount = 60
                },
                new Model
                {
                    Country = "UK", JobDescription = "Marketing", EmployeesCount = 40
                }
            };
        }
    }
Set the ViewModel instance as the DataContext of your window; this is done to bind properties of ViewModel to Sunburst chart.
NOTE
Add namespace of ViewModel class in your XAML page if you prefer to set DataContext in XAML.
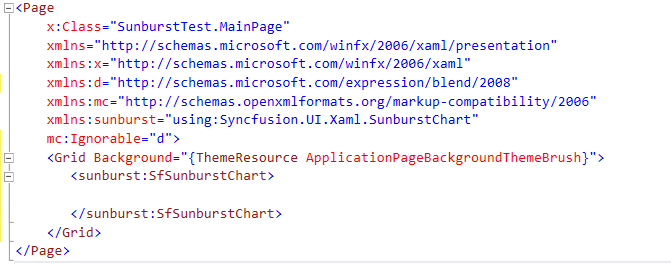
<Page
    x:Class="SunburstTest.MainPage"
    xmlns="http://schemas.microsoft.com/winfx/2006/xaml/presentation"
    xmlns:x="http://schemas.microsoft.com/winfx/2006/xaml"
    xmlns:local="using:GettingStarted"
    xmlns:d="http://schemas.microsoft.com/expression/blend/2008"
    xmlns:mc="http://schemas.openxmlformats.org/markup-compatibility/2006"
    mc:Ignorable="d">
    <Page.DataContext>
        <local:ViewModel/>
    </Page.DataContext>
</Page>this.DataContext = new ViewModel();Populate Sunburst chart with data
Now, bind the Data property of the above ViewModel to the ItemsSource property.
Add SunburstHierarchicalLevel to Levels property. Each hierarchy level is formed based on the property specified in GroupMemberPath property, and each arc segment size is calculated using ValueMemberPath.
<sunburst:SfSunburstChart ItemsSource="{Binding Data}" ValueMemberPath="EmployeesCount">
    <sunburst:SfSunburstChart.Levels>
        <sunburst:SunburstHierarchicalLevel GroupMemberPath="Country"/>
        <sunburst:SunburstHierarchicalLevel GroupMemberPath="JobDescription"/>
        <sunburst:SunburstHierarchicalLevel GroupMemberPath="JobGroup"/>
        <sunburst:SunburstHierarchicalLevel GroupMemberPath="JobRole"/>
    </sunburst:SfSunburstChart.Levels>
</sunburst:SfSunburstChart>
SfSunburstChart sunburst = new SfSunburstChart();
sunburst.ValueMemberPath = "EmployeesCount";
sunburst.SetBinding(SfSunburstChart.ItemsSourceProperty, "Data");
sunburst.Levels.Add(new SunburstHierarchicalLevel() {GroupMemberPath = "Country"});
sunburst.Levels.Add(new SunburstHierarchicalLevel() {GroupMemberPath = "JobDescription"});
sunburst.Levels.Add(new SunburstHierarchicalLevel() {GroupMemberPath = "JobGroup"});
sunburst.Levels.Add(new SunburstHierarchicalLevel() {GroupMemberPath = "JobRole"});Add header
You can add header to Sunburst chart to provide quick information to the user about the data being plotted in the chart. You can set title using Header property as shown below.
<sunburst:SfSunburstChart Header="Employees Count" FontSize="22" />sunburst.Header = "Employees Count";
sunburst.FontSize = 22d;Add legend
You can enable legend using Legend property as shown below,
<sunburst:SfSunburstChart.Legend>
    <sunburst:SunburstLegend DockPosition="Left"/>
</sunburst:SfSunburstChart.Legend>
SunburstLegend legend = new SunburstLegend();
legend.DockPosition= ChartDock.Left;Add data labels
You can add data labels to improve the readability of the Sunburst chart. This can be achieved using DataLabelInfo property as shown below,
<sunburst:SfSunburstChart.DataLabelInfo>
    <sunburst:SunburstDataLabelInfo />
</sunburst:SfSunburstChart.DataLabelInfo>
SunburstDataLabelInfo dataLabel= new SunburstDataLabelInfo();
sunburst.DataLabelInfo = dataLabel;Following is the final output screenshot,
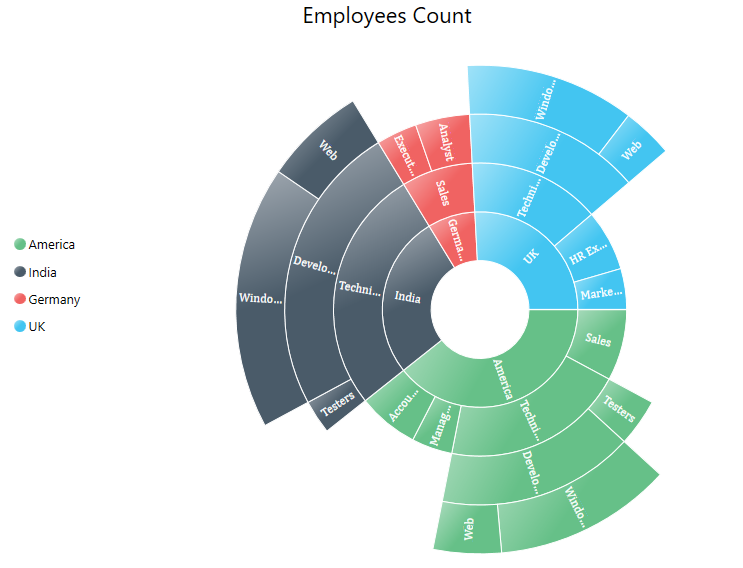
You can find the complete getting started sample from this link.