Empty Points in UWP Charts
18 Nov 201812 minutes to read
The data collection that is passed to the chart can have NaN or Null values that are considered as empty points. The empty point can be defined as in the below code example.
Fruits.Add(new Model() { FruitName = "Mango", People = 5 });
Fruits.Add(new Model() { FruitName = "Apple", People = 27 });
Fruits.Add(new Model() { FruitName = "Orange", People = Double.NaN });
Fruits.Add(new Model() { FruitName = "Grapes", People = 15 });
Fruits.Add(new Model() { FruitName = "Banana", People = 5 });
Fruits.Add(new Model() { FruitName = "Blueberry", People = 20 });
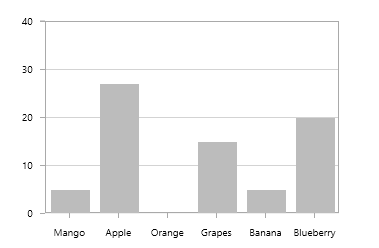
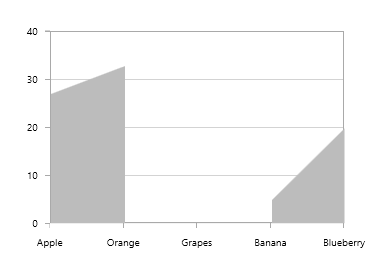
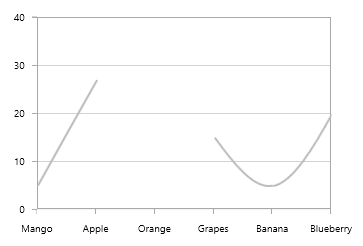
By default, ShowEmptyPoints property is false. So the empty points will not be rendered as in below screenshots:
Display empty points
You can show these empty points by setting the ShowEmptyPoints property to true. So we need to define the value for these empty points and that can be defined using EmptyPointValue property.
This is an enum property having the following values:
-
Zero- Replace all the empty points with zero (0), this is the default value. -
Average- Replace all the empty points with average value.
The following code examples shows how to display the empty points:
<chart:LineSeries
    XBindingPath="FruitName"
    YBindingPath="People"
    Interior="#BCBCBC"
    ShowEmptyPoints="True"
    ItemsSource="{Binding Fruits}">

    <chart:LineSeries.AdornmentsInfo>
        <chart:ChartAdornmentInfo ShowLabel="True" LabelPosition="Auto" />
    </chart:LineSeries.AdornmentsInfo>

</chart:LineSeries>
LineSeries series = new LineSeries()
{
ItemsSource = new ViewModel().Fruits,
XBindingPath = "FruitName",
YBindingPath = "People",
ShowEmptyPoints = true,
Interior = new SolidColorBrush(Color.FromRgb(0xBC, 0xBC, 0xBC))
};
ChartAdornmentInfo adornmentInfo = new ChartAdornmentInfo()
{
ShowLabel = true,
LabelPosition = AdornmentsLabelPosition.Auto
};
series.AdornmentsInfo = adornmentInfo;
chart.Series.Add(series);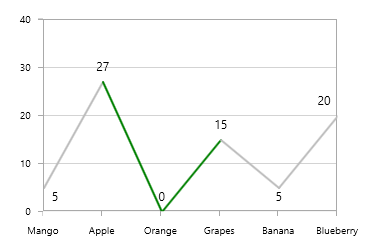
Since the EmptyPointValue as Zero by default, it will draw a line to 0 when we set ShowEmptyPoints as True.
The following code example shows the EmptyPointValue as Average:
<chart:LineSeries
    XBindingPath="FruitName"
    YBindingPath="People"
    Interior="#BCBCBC"
    ShowEmptyPoints="True"
    EmptyPointValue="Average"
    ItemsSource="{Binding Fruits}">

    <chart:LineSeries.AdornmentsInfo>
        <chart:ChartAdornmentInfo ShowLabel="True" LabelPosition="Auto" />
    </chart:LineSeries.AdornmentsInfo>

</chart:LineSeries>
LineSeries series = new LineSeries()
{
ItemsSource = new ViewModel().Fruits,
XBindingPath = "FruitName",
YBindingPath = "People",
ShowEmptyPoints = true,
EmptyPointValue = EmptyPointValue.Average,
Interior = new SolidColorBrush(Color.FromRgb(0xBC, 0xBC, 0xBC))
};
ChartAdornmentInfo adornmentInfo = new ChartAdornmentInfo()
{
ShowLabel = true,
LabelPosition = AdornmentsLabelPosition.Auto
};
series.AdornmentsInfo = adornmentInfo;
chart.Series.Add(series);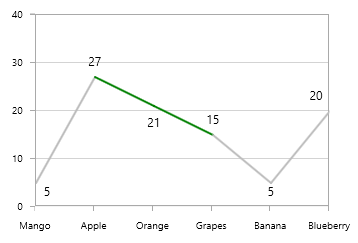
Customizing empty points
You can customize the empty points using EmptyPointStyle property. The following are the values of EmptyPointStyle:
-
Interior- Used to define the custom brush for the empty points. -
Symbol- Used to add symbols for the empty points. -
Symbol and Interior- This is similar to Symbol, which includes empty point brush also.
Interior
This option fills an interior indicating the empty points and this custom brush can be defined using the EmptyPointInterior property.
The following code example illustrates the use of EmptyPointStyle and EmptyPointInterior:
<chart:ColumnSeries
    ItemsSource="{Binding EmptyPointData}"
    Interior="#bcbcbc"
    XBindingPath="Category"
    YBindingPath="Value"
    ShowEmptyPoints="True" />
ColumnSeries series = new ColumnSeries()
{
ItemsSource = new ViewModel().EmptyPointData,
XBindingPath = "Category",
YBindingPath = "Value",
ShowEmptyPoints = true,
Interior = new SolidColorBrush(Color.FromRgb(0xBC, 0xBC, 0xBC))
};
chart.Series.Add(series);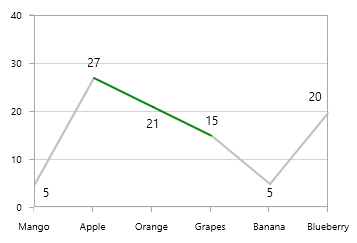
This is the default value for
EmptyPointStyle. So when you enable empty points usingShowEmptyPoints, empty point segment render with thisEmptyPointInterior.
Symbol
This option is used to add Symbol for the empty points as in the below code example.
<chart:LineSeries
    XBindingPath="FruitName"
    YBindingPath="People"
    Interior="#BCBCBC"
    ShowEmptyPoints="True"
    EmptyPointValue="Average"
    EmptyPointStyle="Symbol"
    ItemsSource="{Binding Fruits}">

    <chart:LineSeries.AdornmentsInfo>
        <chart:ChartAdornmentInfo ShowLabel="True" LabelPosition="Auto" />
    </chart:LineSeries.AdornmentsInfo>

</chart:LineSeries>
LineSeries series = new LineSeries()
{
ItemsSource = new ViewModel().Fruits,
XBindingPath = "FruitName",
YBindingPath = "People",
ShowEmptyPoints = true,
EmptyPointValue = EmptyPointValue.Average,
EmptyPointStyle = EmptyPointStyle.Symbol,
Interior = new SolidColorBrush(Color.FromRgb(0xBC, 0xBC, 0xBC))
};
ChartAdornmentInfo adornmentInfo = new ChartAdornmentInfo()
{
ShowLabel = true,
LabelPosition = AdornmentsLabelPosition.Auto
};
series.AdornmentsInfo = adornmentInfo;
chart.Series.Add(series);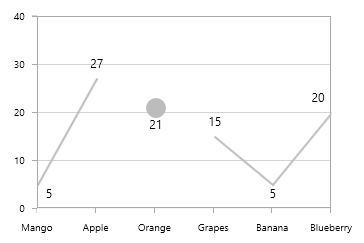
Symbol and interior
This option combines above two options, which draw a symbol with defined EmptyPointInterior. The following code example shows the use of this value.
<chart:LineSeries
    XBindingPath="FruitName"
    YBindingPath="People"
    Interior="#BCBCBC"
    ShowEmptyPoints="True"
    EmptyPointValue="Average"
    EmptyPointStyle="SymbolAndInterior"
    EmptyPointInterior="Red"
    ItemsSource="{Binding Fruits}">

    <chart:LineSeries.AdornmentsInfo>
        <chart:ChartAdornmentInfo ShowLabel="True" LabelPosition="Auto" />
    </chart:LineSeries.AdornmentsInfo>

</chart:LineSeries>
LineSeries series = new LineSeries()
{
ItemsSource = new ViewModel().Fruits,
XBindingPath = "FruitName",
YBindingPath = "People",
ShowEmptyPoints = true,
EmptyPointValue = EmptyPointValue.Average,
EmptyPointStyle = EmptyPointStyle.SymbolAndInterior,
EmptyPointInterior = new SolidColorBrush(Colors.Red),
Interior = new SolidColorBrush(Color.FromRgb(0xBC, 0xBC, 0xBC))
};
ChartAdornmentInfo adornmentInfo = new ChartAdornmentInfo()
{
ShowLabel = true,
LabelPosition = AdornmentsLabelPosition.Auto
};
series.AdornmentsInfo = adornmentInfo;
chart.Series.Add(series);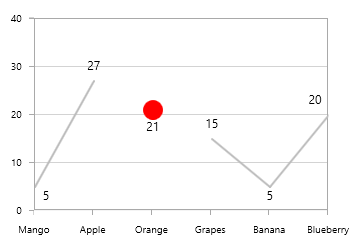
Custom symbol
You can add any custom shape for the empty point symbol. The following code example shows how to add your custom shapes:
<chart:LineSeries
    XBindingPath="FruitName"
    YBindingPath="People"
    Interior="#BCBCBC"
    ShowEmptyPoints="True"
    EmptyPointValue="Average"
    EmptyPointStyle="Symbol"
    EmptyPointInterior="Red"
    ItemsSource="{Binding Fruits}">

    <chart:LineSeries.EmptyPointSymbolTemplate>

        <DataTemplate>

            <Canvas>

                <Grid
                    Canvas.Left="{Binding X}"
                    Canvas.Top="{Binding Y}">

                    <Ellipse
                        Height="50"
                        Width="50"
                        Margin="-15,-15,0,0"
                        Stroke="Gray"
                        StrokeThickness="2"
                        StrokeDashArray="1,1"
                        Fill="Transparent" />

                    <Ellipse
                        Height="35"
                        Width="35"
                        Margin="-15,-15,0,0"
                        Stroke="Gray"
                        StrokeThickness="2"
                        StrokeDashArray="1,3"
                        Fill="LightGray" />

                </Grid>

            </Canvas>

        </DataTemplate>

    </chart:LineSeries.EmptyPointSymbolTemplate>

</chart:LineSeries>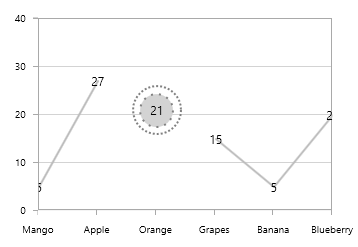
EmptyPoints and series
The following section illustrating few chart types and its behavior with EmptyPoints.
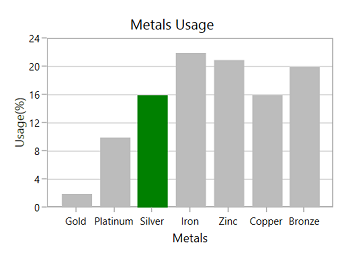
ColumnSeries with EmptyPoint as average
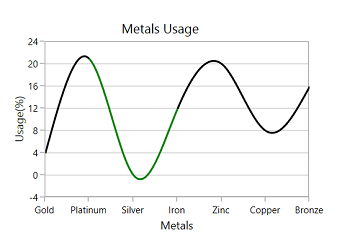
SplineSeries with EmptyPoint as average
Accumulation series with EmptyPoint as average