Chart Types in .NET MAUI Spark Charts
Prerequisite: Ensure that the required NuGet package is installed, the necessary namespaces are imported, and the Spark Charts control is properly configured in your application. For detailed setup and configuration instructions, refer to the Getting Started guide.
The SfSparkChart control supports four chart types: line, area, column, and win-loss.
Line chart
The SfSparkLineChart is used for identifying patterns and trends in the data, such as seasonal effects, large changes, and turning points over a period of time.
<sparkchart:SfSparkLineChart ItemsSource="{Binding Data}"
                    YBindingPath="YValue">
    <!-- code omitted for brevity -->
</sparkchart:SfSparkLineChart>
SfSparkLineChart sparkchart = new SfSparkLineChart()
{
ItemsSource = new SparkChartViewModel().Data,
YBindingPath = "YValue",
};
//code omitted for brevity
this.Content = sparkchart;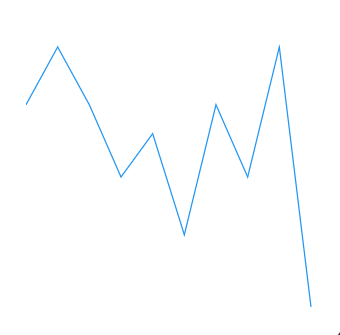
Area chart
The SfSparkAreaChart is used to emphasize a change in values. Use this to communicate the magnitude of a trend rather than individual data values.
<sparkchart:SfSparkAreaChart ItemsSource="{Binding Data}"
                    YBindingPath="YValue">
    <!-- code omitted for brevity -->
</sparkchart:SfSparkAreaChart>
SfSparkAreaChart sparkchart = new SfSparkAreaChart()
{
ItemsSource = new SparkChartViewModel().Data,
YBindingPath = "YValue",
};
//code omitted for brevity
this.Content = sparkchart;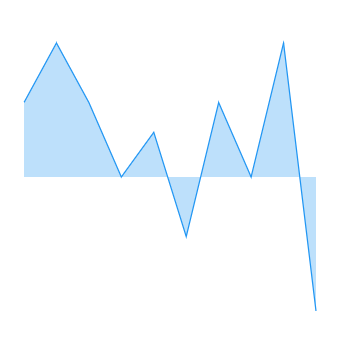
Column chart
The SfSparkColumnChart uses vertical bars to compare values across data points.
<sparkchart:SfSparkColumnChart ItemsSource="{Binding Data}"
                    YBindingPath="YValue">
    <!-- code omitted for brevity -->
</sparkchart:SfSparkColumnChart>
SfSparkColumnChart sparkchart = new SfSparkColumnChart()
{
ItemsSource = new SparkChartViewModel().Data,
YBindingPath = "YValue",
};
//code omitted for brevity
this.Content = sparkchart;
Win-loss chart
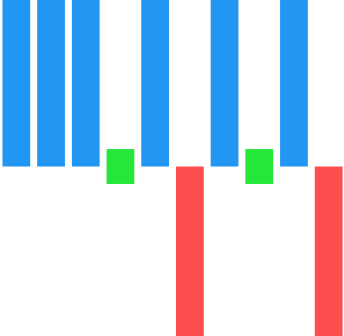
The SfSparkWinLossChart is used to show whether each value is positive or negative, visualizing a win-loss scenario. Positive values are rendered as bars above the axis, negative values as bars below the axis, and zero values are not rendered.
<sparkchart:SfSparkWinLossChart ItemsSource="{Binding Data}"
                     YBindingPath="YValue">
    <!-- code omitted for brevity -->
</sparkchart:SfSparkWinLossChart>
SfSparkWinLossChart sparkchart = new SfSparkWinLossChart()
{
ItemsSource = new SparkChartViewModel().Data,
YBindingPath = "YValue",
};
//code omitted for brevity
this.Content = sparkchart;