Working with Conditional Formatting
14 Aug 202624 minutes to read
Conditional formatting allows you to format the contents of a cell dynamically. It can be defined and applied in XlsIO through the ConditionalFormat class.
Before you begin, complete the Getting Started with Flutter XlsIO steps to add the package, then import it in your Dart file:
import 'dart:ui' show Color;
import 'package:syncfusion_flutter_xlsio/xlsio.dart';
In production code, use
await workbook.save()and wrap workbook usage in atry/finallyblock to guaranteeworkbook.dispose(). The samples below usesaveSync()for brevity.
Create a Conditional Format
The ConditionalFormats collection represents one or more conditional formats applied to a single range. Add a condition to a range as follows.
// Applying conditional formatting to "A1".
final ConditionalFormats conditions =
  sheet.getRangeByName('A1').conditionalFormats;
final ConditionalFormat condition1 = conditions.addCondition();
The target range is evaluated against the criteria you set on the ConditionalFormat instance. The desired rule type is set through the ExcelCFType enumerator, which lists every conditional-format type supported by XlsIO (for example, cellValue, specificText, timePeriod, unique, duplicate, topBottom, aboveBelowAverage, colorScale, iconSet, and dataBar). Refer to the following code.
//Represents conditional format rule that the value in target range should be between 10 and 20
condition1.formatType = ExcelCFType.cellValue;
condition1.operator = ExcelComparisonOperator.between;
condition1.firstFormula = '10';
condition1.secondFormula = '20';
sheet.getRangeByIndex(1, 1).setText('Enter a number between 10 and 20');
When the criteria set for the target range is satisfied, the defined formats (like the ones below) are applied in the order of priority. For more details about conditional format priority, see Manage conditional formatting rule precedence.
formatTypemust be set beforeoperatorand any formula properties, because the operator’s valid values depend on the chosenExcelCFType.
// Setting format properties to be applied when the above condition is met.
// Set the background color using a hexadecimal value.
condition1.backColor = '#209301';
condition1.isBold = true;
condition1.isItalic = true;
The following code creates and applies various different conditional formats for different ranges in XlsIO.
// Create a new Excel Document.
final Workbook workbook = Workbook();

// Accessing sheet via index.
final Worksheet sheet = workbook.worksheets[0];

//Applying conditional formatting to "A1".
ConditionalFormats conditions = sheet.getRangeByName('A1').conditionalFormats;
final ConditionalFormat condition1 = conditions.addCondition();

// Represents a conditional-format rule that requires the value in the target range to be between 10 and 20.
condition1.formatType = ExcelCFType.cellValue;
condition1.operator = ExcelComparisonOperator.between;
condition1.firstFormula = '10';
condition1.secondFormula = '20';
sheet.getRangeByIndex(1, 1).setText('Enter a number between 10 and 20');

// Setting format properties to be applied when the above condition is met.
// Set the background color using a hexadecimal value.
condition1.backColor = '#66FF99';
// Set the font color using a hexadecimal value.
condition1.fontColor = '#448EBC';
// Set the font as bold.
condition1.isBold = true;
// Set the font as italic.
condition1.isItalic = true;

//Applying conditional formatting to "A3".
conditions = sheet.getRangeByName('A3').conditionalFormats;
final ConditionalFormat condition2 = conditions.addCondition();

// Represents a conditional-format rule that requires the cell value to equal 100.
condition2.formatType = ExcelCFType.cellValue;
condition2.operator = ExcelComparisonOperator.equal;
condition2.firstFormula = '100';
sheet.getRangeByIndex(3, 1).setText('Enter the Number as 100');

// Setting format properties to be applied when the above condition is met.
// Set the font color using a hexadecimal value.
condition2.fontColor = '#FF1574';
// Set the top border line style.
condition2.topBorderStyle = LineStyle.thick;
// Set the top border color using a hexadecimal value.
condition2.topBorderColor = '#FFCC00';
// Set the number format.
condition2.numberFormat = '0.0';

//Applying conditional formatting to "A5".
conditions = sheet.getRangeByName('A5').conditionalFormats;
final ConditionalFormat condition3 = conditions.addCondition();

// Represents a conditional-format rule that requires the cell value to be greater than or equal to 50.
condition3.formatType = ExcelCFType.cellValue;
condition3.operator = ExcelComparisonOperator.greaterOrEqual;
condition3.firstFormula = '50';
sheet
  .getRangeByIndex(5, 1)
    .setText('Enter the number value greater than or equal to 50.');

// Setting format properties to be applied when the above condition is met.
// Set the background color using RGB color values.
condition3.backColorRgb = Color.fromARGB(255, 150, 200, 50);
// Set the font color using RGB color values.
condition3.fontColorRgb = Color.fromARGB(255, 200, 20, 100);
// Underline the font.
condition3.underline = true;
// Set the right border line style.
condition3.rightBorderStyle = LineStyle.double;
// Set the right border color using RGB color values.
condition3.rightBorderColorRgb = Color.fromARGB(240, 24, 160, 200);
// Set the bottom border line style.
condition3.bottomBorderStyle = LineStyle.thin;
// Set the bottom border color using RGB color values.
condition3.bottomBorderColorRgb = Color.fromARGB(255, 240, 160, 200);

//save and dispose.
final List<int> bytes = workbook.saveSync();
File('ConditionalFormatting.xlsx').writeAsBytes(bytes);
workbook.dispose();
The conditional formats for a single range should be added in descending order of priority in Flutter XlsIO. Lower-priority rules are added first so the highest-priority rule is evaluated last.
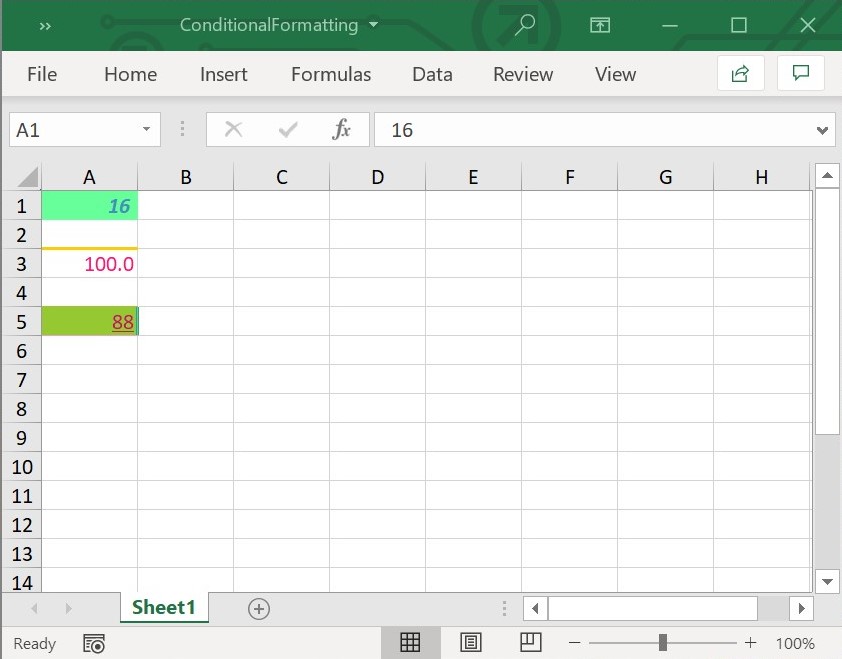
When proper criteria is met, the output file looks as follows:
Using FormulaR1C1 property in Conditional Formats
Flutter XlsIO can set the formula for a conditional format in R1C1-style notation using the firstFormulaR1C1 and secondFormulaR1C1 properties. R1C1 notation uses relative references of the form R[r]C[c], where R[1] means “one row below the current cell” and C[0] means “the same column”. For absolute references, drop the brackets (for example, R1C1).
The following code example illustrates this.
// Create a new Excel Document.
final Workbook workbook = Workbook();

// Accessing sheet via index.
final Worksheet sheet = workbook.worksheets[0];
sheet.getRangeByIndex(1, 1).setNumber(123);
sheet.getRangeByIndex(2, 1).setNumber(23);
sheet.getRangeByIndex(3, 1).setNumber(25);
sheet.getRangeByIndex(4, 1).setNumber(5);
sheet.getRangeByIndex(5, 1).setNumber(44);
sheet.getRangeByIndex(6, 1).setNumber(2);
sheet.getRangeByIndex(7, 1).setNumber(67);
sheet.getRangeByIndex(8, 1).setNumber(92);
sheet.getRangeByIndex(9, 1).setNumber(68);
sheet.getRangeByIndex(10, 1).setNumber(84);

//Applying conditional formatting to "A1:D4".
final ConditionalFormats conditions =
sheet.getRangeByName('A1:D4').conditionalFormats;
final ConditionalFormat condition1 = conditions.addCondition();
condition1.formatType = ExcelCFType.cellValue;
condition1.operator = ExcelComparisonOperator.between;
condition1.firstFormulaR1C1 = '=R[1]C[0]';
condition1.secondFormulaR1C1 = '=R[8]C[0]';

//save and dispose.
final List<int> bytes = workbook.saveSync();
File('FormulaR1C1.xlsx').writeAsBytes(bytes);
workbook.dispose();
Format Specific Text
Specific-text conditional formatting is used to format an Excel range that contains a given text using the ExcelCFType.specificText value and the text property. The valid operators are containsText, notContainsText, beginsWith, and endsWith.
The following code example shows how to format specific text using conditional formatting in Flutter XlsIO.
// Create a new Excel document.
final Workbook workbook = Workbook();

// Accessing sheet via index.
final Worksheet sheet = workbook.worksheets[0];

// Applying conditional formatting.
final ConditionalFormats conditions =
    sheet.getRangeByName('A1:A10').conditionalFormats;
final ConditionalFormat condition1 = conditions.addCondition();
condition1.formatType = ExcelCFType.specificText;
condition1.operator = ExcelComparisonOperator.containsText;
condition1.text = 'm';
condition1.backColor = '#00FF99';
condition1.fontColor = '#CE2622';
condition1.isItalic = true;
condition1.isBold = true;
condition1.underline = true;
condition1.bottomBorderStyle = LineStyle.medium;
condition1.bottomBorderColor = '#FB5825';
condition1.topBorderStyle = LineStyle.double;
condition1.topBorderColor = '#CCFD31';
condition1.rightBorderStyle = LineStyle.thick;
condition1.rightBorderColor = '#A44C9A';
condition1.leftBorderStyle = LineStyle.thin;
condition1.leftBorderColor = '#CC00CC';

// Setting values in the cells.
sheet.getRangeByIndex(1, 1).setText('John');
sheet.getRangeByIndex(2, 1).setText('James');
sheet.getRangeByIndex(3, 1).setText('Anne');
sheet.getRangeByIndex(4, 1).setText('Jai');
sheet.getRangeByIndex(5, 1).setText('Harish');
sheet.getRangeByIndex(6, 1).setText('Dinesh');
sheet.getRangeByIndex(7, 1).setText('Avnish');
sheet.getRangeByIndex(8, 1).setText('Yamini');
sheet.getRangeByIndex(9, 1).setText('Kani');
sheet.getRangeByIndex(10, 1).setText('Anu');

//save and dispose.
final List<int> bytes = workbook.saveSync();
File('CFSpecificText.xlsx').writeAsBytes(bytes);
workbook.dispose();
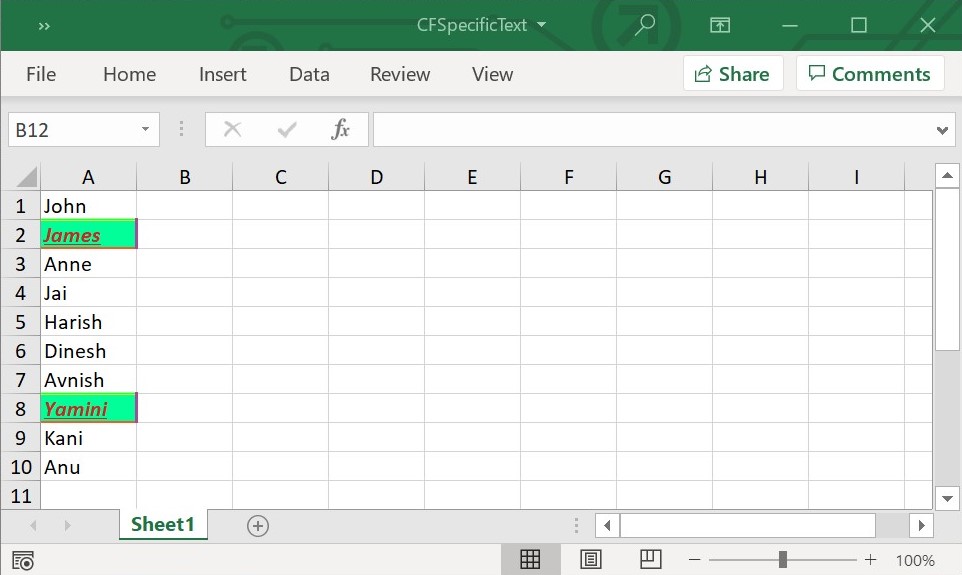
The following screenshot represents generated Excel file with specific text conditional format in Flutter XlsIO.
Format Date Occurring
Date-occurring conditional formatting is used to format an Excel range that contains a given date using the ExcelCFType.timePeriod value and the CFTimePeriods enumeration. The supported CFTimePeriods values are today, yesterday, tomorrow, last7Days, lastWeek, thisWeek, nextWeek, lastMonth, thisMonth, and nextMonth.
The following code example shows how to format date-occurring conditional formatting in Flutter XlsIO.
// Create a new Excel document.
final Workbook workbook = Workbook();

// Accessing sheet via index.
final Worksheet sheet = workbook.worksheets[0];

// Applying conditional formatting.
final ConditionalFormats conditions =
  sheet.getRangeByName('A1:A10').conditionalFormats;
final ConditionalFormat condition = conditions.addCondition();

// Represents a conditional-format rule for cells whose date matches the "yesterday" time period.
condition.formatType = ExcelCFType.timePeriod;
condition.timePeriodType = CFTimePeriods.yesterday;

// Setting format properties to be applied when the above condition is met.
condition.backColor = '#FFFF00';
condition.fontColor = '#FF33CC';
condition.isItalic = true;
condition.isBold = true;
condition.underline = true;
condition.bottomBorderStyle = LineStyle.medium;
condition.bottomBorderColor = '#2F2BD3';
condition.topBorderStyle = LineStyle.double;
condition.topBorderColor = '#44BA9B';
condition.rightBorderStyle = LineStyle.thick;
condition.rightBorderColor = '#663300';
condition.leftBorderStyle = LineStyle.thin;
condition.leftBorderColor = '#823B89';
condition.numberFormat = 'd-mmm';

// Setting value in the cell.
final now = DateTime.now();
sheet
  .getRangeByIndex(1, 1)
  .setDateTime(DateTime(now.year, now.month, now.day));
sheet
  .getRangeByIndex(2, 1)
  .setDateTime(DateTime(now.year, now.month, now.day - 1));
sheet
  .getRangeByIndex(3, 1)
  .setDateTime(DateTime(now.year, now.month, now.day));
sheet
  .getRangeByIndex(4, 1)
  .setDateTime(DateTime(now.year, now.month, now.day + 1));
sheet
  .getRangeByIndex(5, 1)
  .setDateTime(DateTime(now.year, now.month, now.day - 1));
sheet
  .getRangeByIndex(6, 1)
  .setDateTime(DateTime(now.year, now.month, now.day + 1));
sheet
  .getRangeByIndex(7, 1)
  .setDateTime(DateTime(now.year, now.month, now.day - 1));
sheet
  .getRangeByIndex(8, 1)
  .setDateTime(DateTime(now.year, now.month, now.day - 1));
sheet
  .getRangeByIndex(9, 1)
  .setDateTime(DateTime(now.year, now.month, now.day));
sheet
  .getRangeByIndex(10, 1)
  .setDateTime(DateTime(now.year, now.month, now.day + 1));

sheet.autoFitColumn(1);

//save and dispose.
final List<int> bytes = workbook.saveSync();
File('CFDateoccurring.xlsx').writeAsBytes(bytes);
workbook.dispose();
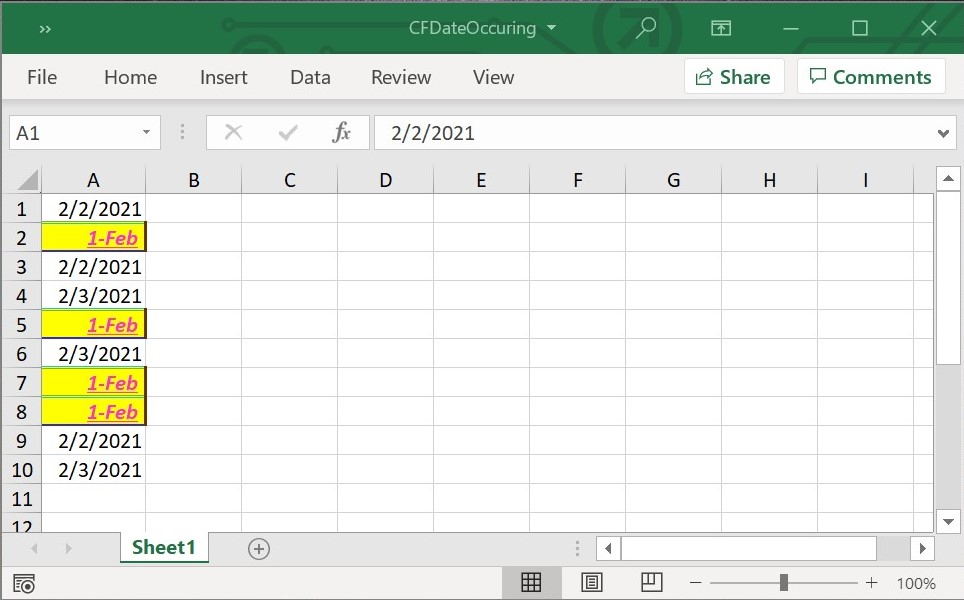
The following screenshot represents generated Excel file with date occurring conditional format in Flutter XlsIO.
Format Unique and Duplicate Values
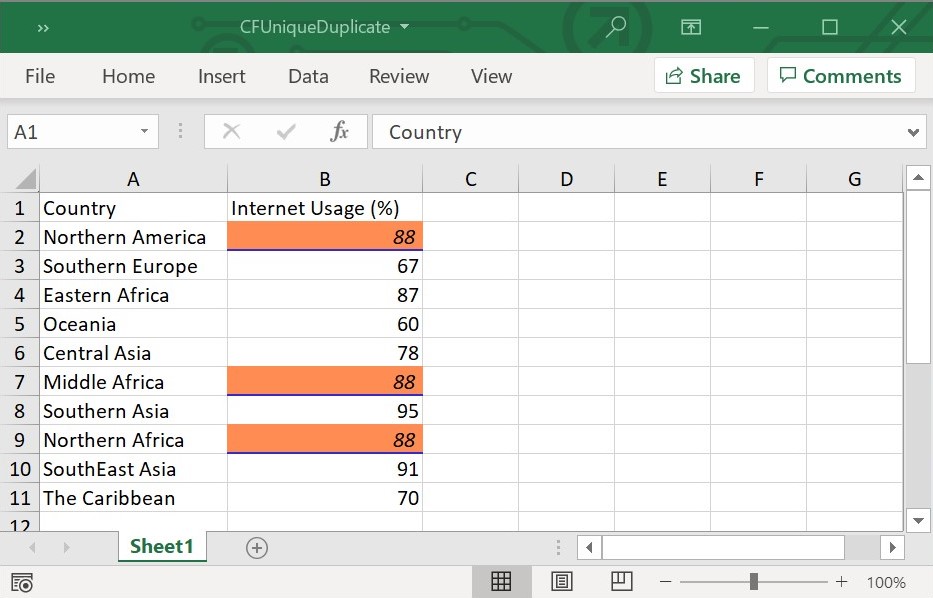
Use conditional formatting to highlight unique and duplicate values in an Excel range. The ExcelCFType.unique and ExcelCFType.duplicate enumerator values produce these rules; no operator or formula is required.
The following code example shows how to format unique and duplicate values using conditional formatting in XlsIO.
// Create a new Excel document.
final Workbook workbook = Workbook();

// Accessing sheet via index.
final Worksheet sheet = workbook.worksheets[0];

// Setting values in the cells.
sheet.getRangeByIndex(1, 1).setText('Country');
sheet.getRangeByIndex(2, 1).setText('Northern America');
sheet.getRangeByIndex(3, 1).setText('Southern Europe');
sheet.getRangeByIndex(4, 1).setText('Eastern Africa');
sheet.getRangeByIndex(5, 1).setText('Oceania');
sheet.getRangeByIndex(6, 1).setText('Central Asia');
sheet.getRangeByIndex(7, 1).setText('Middle Africa');
sheet.getRangeByIndex(8, 1).setText('Southern Asia');
sheet.getRangeByIndex(9, 1).setText('Northern Africa');
sheet.getRangeByIndex(10, 1).setText('SouthEast Asia');
sheet.getRangeByIndex(11, 1).setText('The Caribbean');

sheet.getRangeByIndex(1, 2).setText('Internet Usage (%)');
sheet.getRangeByIndex(2, 2).setNumber(88);
sheet.getRangeByIndex(3, 2).setNumber(67);
sheet.getRangeByIndex(4, 2).setNumber(87);
sheet.getRangeByIndex(5, 2).setNumber(60);
sheet.getRangeByIndex(6, 2).setNumber(78);
sheet.getRangeByIndex(7, 2).setNumber(88);
sheet.getRangeByIndex(8, 2).setNumber(95);
sheet.getRangeByIndex(9, 2).setNumber(88);
sheet.getRangeByIndex(10, 2).setNumber(91);
sheet.getRangeByIndex(11, 2).setNumber(70);

sheet.autoFitColumn(1);
sheet.autoFitColumn(2);

// Applying conditional formatting.
final ConditionalFormats conditions =
  sheet.getRangeByName('B1:B11').conditionalFormats;
final ConditionalFormat condition = conditions.addCondition();

// Represents a conditional-format rule that highlights cells with duplicate values.
condition.formatType = ExcelCFType.duplicate;

// Setting format properties to be applied when the above condition is met.
condition.backColor = '#FF8C53';
condition.isItalic = true;
condition.bottomBorderStyle = LineStyle.medium;
condition.bottomBorderColor = '#2F2BD3';

//save and dispose.
final List<int> bytes = workbook.saveSync();
File('CFUniqueDuplicate.xlsx').writeAsBytes(bytes);
workbook.dispose();
The following screenshot represents the generated Excel file with unique and duplicate conditional format in Flutter XlsIO.
Format Top or Bottom Values
Top/Bottom rule in conditional formatting is used to highlight the top or bottom ranked cells in a data range. Top/Bottom conditional formatting rule can be created and customized using the TopBottom class in Flutter XlsIO.
The properties of TopBottom class are:
- type - Specifies whether the rank is evaluated from the top or bottom.
- percent - Specifies whether the rank is determined by a percentage value.
- rank - Specifies the maximum number or percentage of cells to be highlighted.
Top/Bottom ‘n’ rank Values
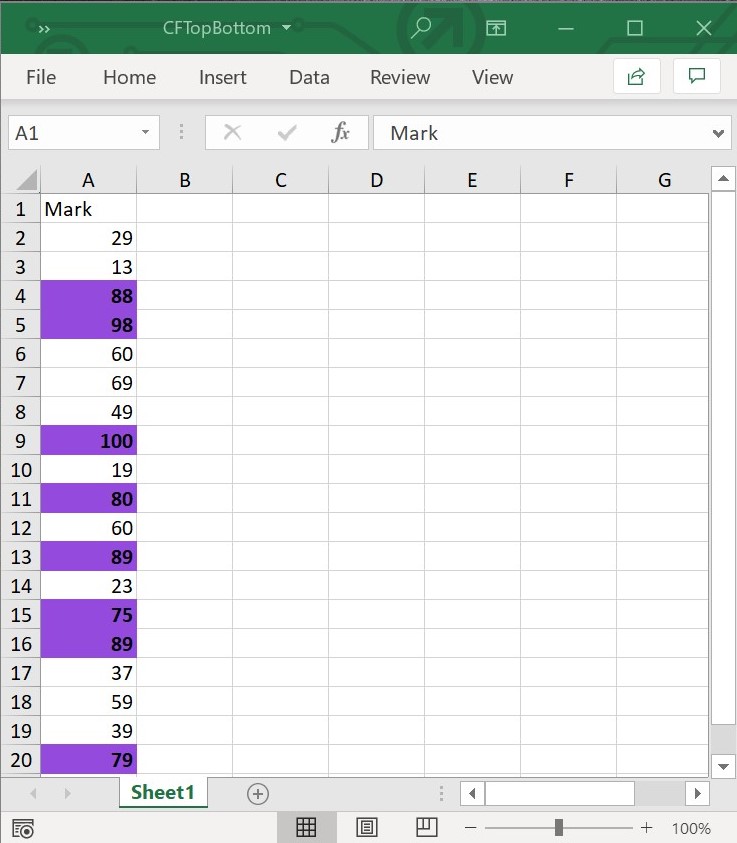
The following code example shows how to format the top 8 ranked values from the given data range using the TopBottom type and rank properties in XlsIO.
// Create a new Excel document.
final Workbook workbook = Workbook();

// Accessing sheet via index.
final Worksheet sheet = workbook.worksheets[0];

// Setting value in the cell.
sheet.getRangeByIndex(1, 1).setText('Mark');
sheet.getRangeByIndex(2, 1).setNumber(29);
sheet.getRangeByIndex(3, 1).setNumber(13);
sheet.getRangeByIndex(4, 1).setNumber(88);
sheet.getRangeByIndex(5, 1).setNumber(98);
sheet.getRangeByIndex(6, 1).setNumber(60);
sheet.getRangeByIndex(7, 1).setNumber(69);
sheet.getRangeByIndex(8, 1).setNumber(49);
sheet.getRangeByIndex(9, 1).setNumber(100);
sheet.getRangeByIndex(10, 1).setNumber(19);
sheet.getRangeByIndex(11, 1).setNumber(80);
sheet.getRangeByIndex(12, 1).setNumber(60);
sheet.getRangeByIndex(13, 1).setNumber(89);
sheet.getRangeByIndex(14, 1).setNumber(23);
sheet.getRangeByIndex(15, 1).setNumber(75);
sheet.getRangeByIndex(16, 1).setNumber(89);
sheet.getRangeByIndex(17, 1).setNumber(37);
sheet.getRangeByIndex(18, 1).setNumber(59);
sheet.getRangeByIndex(19, 1).setNumber(39);
sheet.getRangeByIndex(20, 1).setNumber(79);

// Applying conditional formatting.
final ConditionalFormats conditions =
  sheet.getRangeByName('A1:A20').conditionalFormats;
final ConditionalFormat condition = conditions.addCondition();

//Applying top or bottom rule in the conditional formatting.
condition.formatType = ExcelCFType.topBottom;
final TopBottom topBottom = condition.topBottom!;

//Set type as Top for TopBottom rule.
topBottom.type = ExcelCFTopBottomType.top;

//Set rank value for the TopBottom rule.
topBottom.rank = 8;

//Setting format properties to be applied when the above condition is met.
condition.backColor = '#934ADD';
condition.isBold = true;

//save and dispose.
final List<int> bytes = workbook.saveSync();
File('CFTopBottom.xlsx').writeAsBytes(bytes);
workbook.dispose();
The following screenshot represents the Excel file generated with TopBottom conditional format with rank set to 8 in XlsIO.
TopBottomrankvalue should be in a range between 1 and 1000.
Top/Bottom ‘n’% rank Values
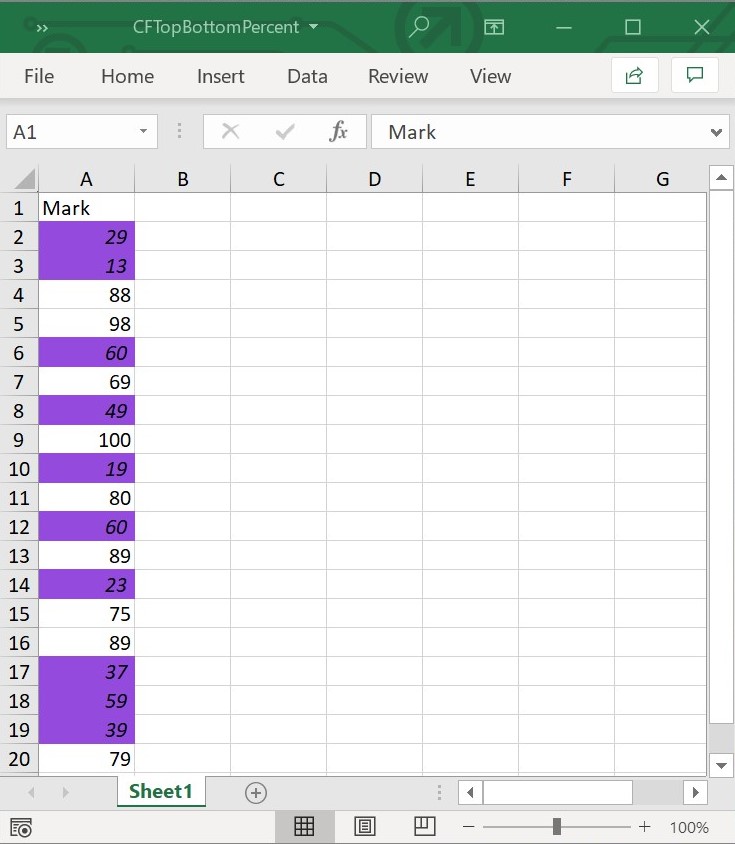
The following code example shows how to format the bottom 50 percent of ranked values from the given data range using the TopBottom type, rank, and percent properties in XlsIO.
// Create a new Excel document.
final Workbook workbook = Workbook();

// Accessing sheet via index.
final Worksheet sheet = workbook.worksheets[0];

// Setting value in the cell.
sheet.getRangeByIndex(1, 1).setText('Mark');
sheet.getRangeByIndex(2, 1).setNumber(29);
sheet.getRangeByIndex(3, 1).setNumber(13);
sheet.getRangeByIndex(4, 1).setNumber(88);
sheet.getRangeByIndex(5, 1).setNumber(98);
sheet.getRangeByIndex(6, 1).setNumber(60);
sheet.getRangeByIndex(7, 1).setNumber(69);
sheet.getRangeByIndex(8, 1).setNumber(49);
sheet.getRangeByIndex(9, 1).setNumber(100);
sheet.getRangeByIndex(10, 1).setNumber(19);
sheet.getRangeByIndex(11, 1).setNumber(80);
sheet.getRangeByIndex(12, 1).setNumber(60);
sheet.getRangeByIndex(13, 1).setNumber(89);
sheet.getRangeByIndex(14, 1).setNumber(23);
sheet.getRangeByIndex(15, 1).setNumber(75);
sheet.getRangeByIndex(16, 1).setNumber(89);
sheet.getRangeByIndex(17, 1).setNumber(37);
sheet.getRangeByIndex(18, 1).setNumber(59);
sheet.getRangeByIndex(19, 1).setNumber(39);
sheet.getRangeByIndex(20, 1).setNumber(79);

// Applying conditional formatting.
final ConditionalFormats conditions =
    sheet.getRangeByName('A1:A20').conditionalFormats;
final ConditionalFormat condition = conditions.addCondition();

//Applying top or bottom rule in the conditional formatting.
condition.formatType = ExcelCFType.topBottom;
final TopBottom topBottom = condition.topBottom!;

// Set the rule type to Bottom for the TopBottom rule.
topBottom.type = ExcelCFTopBottomType.bottom;

// Set percent to true for the TopBottom rule so rank is treated as a percentage.
topBottom.percent = true;

// Set the rank value (as a percentage) for the TopBottom rule.
topBottom.rank = 50;

// Setting format properties to be applied when the above condition is met.
condition.backColor = '#934ADD';
condition.isItalic = true;

//save and dispose.
final List<int> bytes = workbook.saveSync();
File('CFTopBottomPercent.xlsx').writeAsBytes(bytes);
workbook.dispose();
The following screenshot represents the Excel file generated with TopBottom conditional format with percent value set to 50 in Flutter XlsIO.
TopBottomRankvalue should be in a range between 1 and 100 when set true toPercentproperty.
Format Above or Below Average Values
The above/below-average rule in conditional formatting is used to highlight the cells whose values are above or below the average in a data range. This rule can be created and customized using the AboveBelowAverage class in Flutter XlsIO.
The properties of AboveBelowAverage are:
- averageType - Specifies whether the conditional formatting rule looks for cell values that are above average or below average or standard deviation.
-
stdDevValue - Specifies standard deviation number for
AboveBelowAverageconditional formatting rule.
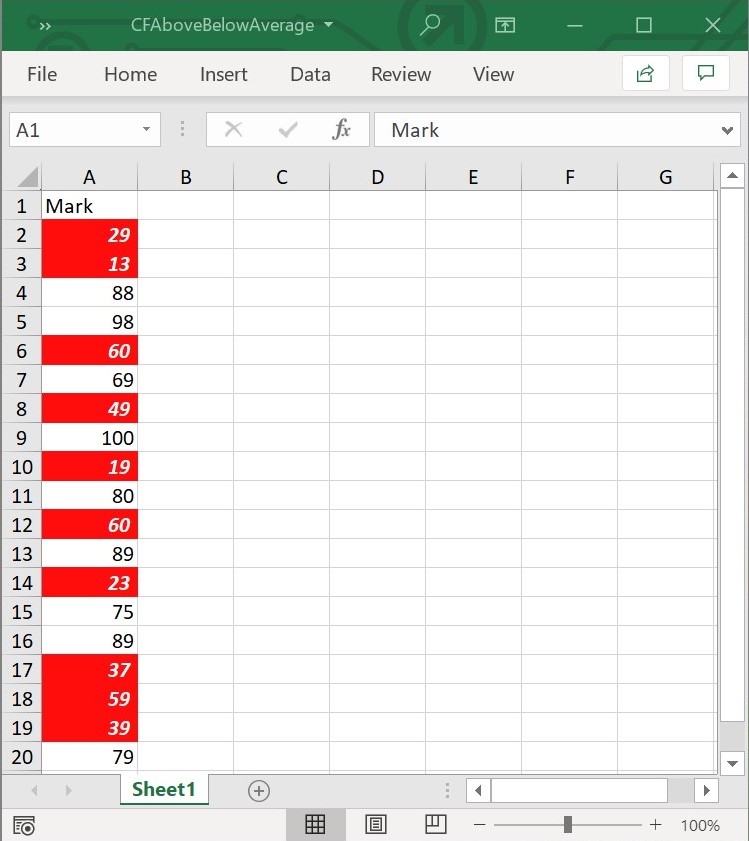
The following code example shows how to format a range with values that are below average using the AboveBelowAverage averageType property in XlsIO.
// Create a new Excel document.
final Workbook workbook = Workbook();

// Accessing sheet via index.
final Worksheet sheet = workbook.worksheets[0];

// Setting value in the cell.
sheet.getRangeByIndex(1, 1).setText('Mark');
sheet.getRangeByIndex(2, 1).setNumber(29);
sheet.getRangeByIndex(3, 1).setNumber(13);
sheet.getRangeByIndex(4, 1).setNumber(88);
sheet.getRangeByIndex(5, 1).setNumber(98);
sheet.getRangeByIndex(6, 1).setNumber(60);
sheet.getRangeByIndex(7, 1).setNumber(69);
sheet.getRangeByIndex(8, 1).setNumber(49);
sheet.getRangeByIndex(9, 1).setNumber(100);
sheet.getRangeByIndex(10, 1).setNumber(19);
sheet.getRangeByIndex(11, 1).setNumber(80);
sheet.getRangeByIndex(12, 1).setNumber(60);
sheet.getRangeByIndex(13, 1).setNumber(89);
sheet.getRangeByIndex(14, 1).setNumber(23);
sheet.getRangeByIndex(15, 1).setNumber(75);
sheet.getRangeByIndex(16, 1).setNumber(89);
sheet.getRangeByIndex(17, 1).setNumber(37);
sheet.getRangeByIndex(18, 1).setNumber(59);
sheet.getRangeByIndex(19, 1).setNumber(39);
sheet.getRangeByIndex(20, 1).setNumber(79);

// Applying conditional formatting.
final ConditionalFormats conditions =
  sheet.getRangeByName('A1:A20').conditionalFormats;
final ConditionalFormat condition = conditions.addCondition();

// Applying the above or below average rule in the conditional formatting.
condition.formatType = ExcelCFType.aboveBelowAverage;
final AboveBelowAverage aboveBelowAverage = condition.aboveBelowAverage!;

// Set AverageType to Below for the AboveBelowAverage rule.
aboveBelowAverage.averageType = ExcelCFAverageType.below;

// Set the colors for the conditional formatting.
condition.backColor = '#FF0D0D';
condition.fontColor = '#FFFFFF';
condition.isItalic = true;
condition.isBold = true;

//save and dispose.
final List<int> bytes = workbook.saveSync();
File('CFAboveBelowAverage.xlsx').writeAsBytes(bytes);
workbook.dispose();
The following screenshot represents the Excel file generated with AboveBelowAverage conditional format with averageType set as below in Flutter XlsIO.
Above or Below Standard Deviation Values
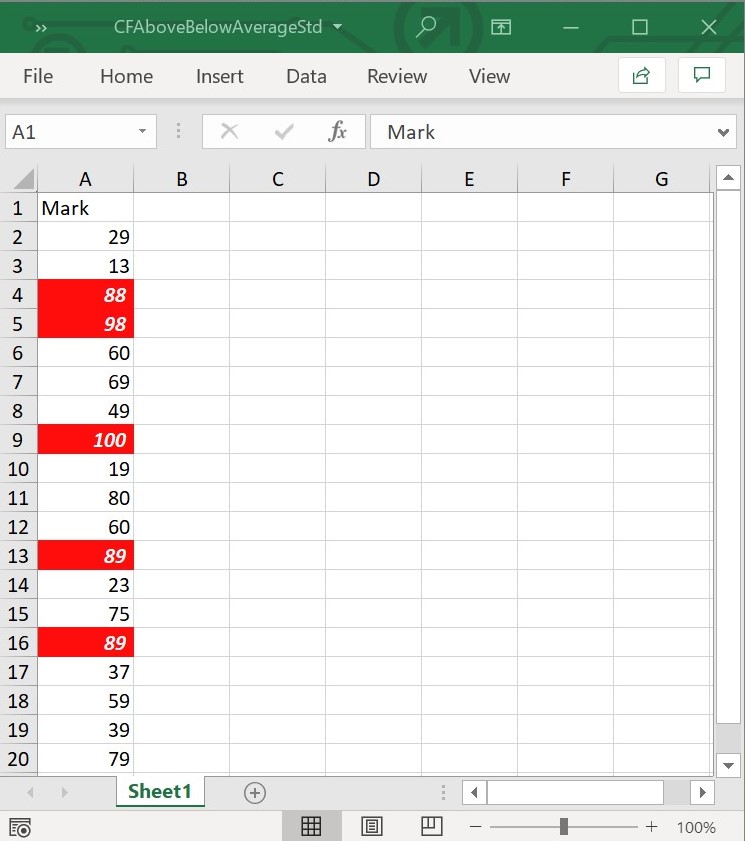
The following code example shows how to format a range with values above the standard deviation, using the AboveBelowAverage averageType and stdDevValue properties in XlsIO.
// Create a new Excel document.
final Workbook workbook = Workbook();

// Accessing sheet via index.
final Worksheet sheet = workbook.worksheets[0];

// Setting value in the cell.
sheet.getRangeByIndex(1, 1).setText('Mark');
sheet.getRangeByIndex(2, 1).setNumber(29);
sheet.getRangeByIndex(3, 1).setNumber(13);
sheet.getRangeByIndex(4, 1).setNumber(88);
sheet.getRangeByIndex(5, 1).setNumber(98);
sheet.getRangeByIndex(6, 1).setNumber(60);
sheet.getRangeByIndex(7, 1).setNumber(69);
sheet.getRangeByIndex(8, 1).setNumber(49);
sheet.getRangeByIndex(9, 1).setNumber(100);
sheet.getRangeByIndex(10, 1).setNumber(19);
sheet.getRangeByIndex(11, 1).setNumber(80);
sheet.getRangeByIndex(12, 1).setNumber(60);
sheet.getRangeByIndex(13, 1).setNumber(89);
sheet.getRangeByIndex(14, 1).setNumber(23);
sheet.getRangeByIndex(15, 1).setNumber(75);
sheet.getRangeByIndex(16, 1).setNumber(89);
sheet.getRangeByIndex(17, 1).setNumber(37);
sheet.getRangeByIndex(18, 1).setNumber(59);
sheet.getRangeByIndex(19, 1).setNumber(39);
sheet.getRangeByIndex(20, 1).setNumber(79);

// Applying conditional formatting.
final ConditionalFormats conditions =
    sheet.getRangeByName('A1:A20').conditionalFormats;
final ConditionalFormat condition = conditions.addCondition();

// Applying the above or below average rule in the conditional formatting.
condition.formatType = ExcelCFType.aboveBelowAverage;
final AboveBelowAverage aboveBelowAverage = condition.aboveBelowAverage!;

// Set AverageType to AboveStdDev for the AboveBelowAverage rule.
aboveBelowAverage.averageType = ExcelCFAverageType.aboveStdDev;

// Set the StdDevValue property for the AboveBelowAverage rule.
aboveBelowAverage.stdDevValue = 1;

// Set the colors for the conditional formatting.
condition.backColor = '#FF0D0D';
condition.fontColor = '#FFFFFF';
condition.isItalic = true;
condition.isBold = true;

//save and dispose.
final List<int> bytes = workbook.saveSync();
File('CFAboveBelowAverageStd.xlsx').writeAsBytes(bytes);
workbook.dispose();
The following screenshot represents the Excel file generated with AboveBelowAverage conditional format when averageType is set as aboveStdDev in Flutter XlsIO.
AboveBelowAveragestdDevValuecan be applied only if theaverageTypeisaboveStdDevorbelowStdDev. ThestdDevValuevalue should be in a range between 1 and 3.
Advanced Conditional Format Types
In conjunction with basic conditional formatting, the modern formatting visualizations — Color Scales, Icon Sets, and Data Bars — are also supported in Flutter XlsIO.
Color scales let you create visual effects in your data to see how the value of a cell compares with the values in a range of cells. A color scale uses cell shading, as opposed to bars, to communicate relative values.
Creation of color scales and their formatting rules using the ColorScale class in Flutter XlsIO is illustrated as follows. The ConditionValueType enumeration values used here include lowestValue, highestValue, percent, percentile, number, and formula.
// Create color scales for the data in the specified range.
final ConditionalFormats conditionalFormats =
    sheet.getRangeByName('B1:B11').conditionalFormats;
final ConditionalFormat conditionalFormat = conditionalFormats.addCondition();
conditionalFormat.formatType = ExcelCFType.colorScale;
final ColorScale colorScale = conditionalFormat.colorScale!;

// Set a 3-color scale.
colorScale.setConditionCount(3);
// Set the format color for the color scale using a hexadecimal value.
colorScale.criteria[0].formatColor = '#2C36F6';
colorScale.criteria[0].type = ConditionValueType.lowestValue;
colorScale.criteria[0].value = '0';

// Set the format color for the color scale using RGB color values.
colorScale.criteria[1].formatColorRgb = Color.fromARGB(255, 200, 20, 100);
colorScale.criteria[1].type = ConditionValueType.percentile;
colorScale.criteria[1].value = '50';

// Set the format color for the color scale using a hexadecimal value.
colorScale.criteria[2].formatColor = '#F06506';
colorScale.criteria[2].type = ConditionValueType.highestValue;
colorScale.criteria[2].value = '0';
Icon Sets
Icon sets present data in three to five categories that are distinguished by a threshold value. Each icon represents a range of values, and each cell is annotated with the icon that represents that range. The ExcelIconSetType enumeration includes preset styles such as threeArrows, threeArrowsGray, threeFlags, threeTrafficLights1, threeTrafficLights2, threeSigns, threeSymbols, threeSymbols2, threeStars, fourArrows, fourArrowsGray, fourRedToBlack, fourRating, fourTrafficLights, fiveArrows, fiveArrowsGray, fiveRating, and fiveQuarters.
Icon sets can be created and customized in Flutter XlsIO as follows.
// Create icon sets for the data in the specified range.
final ConditionalFormats conditionalFormats = sheet.getRangeByName('C1:C11').conditionalFormats;
final ConditionalFormat conditionalFormat = conditionalFormats.addCondition();
conditionalFormat.formatType = ExcelCFType.iconSet;
final IconSet iconSet = conditionalFormat.iconSet!;

// Apply a three-symbol icon and hide the data in the specified range.
iconSet.iconSet = ExcelIconSetType.threeSymbols;
iconSet.iconCriteria[1].type = ConditionValueType.percent;
iconSet.iconCriteria[1].value = "50";
iconSet.iconCriteria[2].type = ConditionValueType.percent;
iconSet.iconCriteria[2].value = "50";
iconSet.showIconOnly = true;
Custom Icon Sets
You can customize the icon set by changing the iconSet and index properties for each icon criterion. The ConditionalFormatOperator enumeration values used here include greaterThan, greaterThanOrEqual, lessThan, lessThanOrEqual, equal, notEqual, between, and notBetween.
Custom icon sets can be created and customized in Flutter XlsIO as follows.
// Create a new Excel Document.
final Workbook workbook = Workbook();

// Accessing sheet via index.
final Worksheet sheet = workbook.worksheets[0];

sheet.getRangeByName('A1').setNumber(125);
sheet.getRangeByName('A2').setNumber(279);
sheet.getRangeByName('A3').setNumber(42);
sheet.getRangeByName('A4').setNumber(384);
sheet.getRangeByName('A5').setNumber(129);
sheet.getRangeByName('A6').setNumber(212);
sheet.getRangeByName('A7').setNumber(131);
sheet.getRangeByName('A8').setNumber(230);

// Create icon set for the data in the specified range.
final ConditionalFormats conditionalFormats =
  sheet.getRangeByName('A1:A10').conditionalFormats;
final ConditionalFormat conditionalFormat = conditionalFormats.addCondition();
// Set FormatType as IconSet.
conditionalFormat.formatType = ExcelCFType.iconSet;
final IconSet iconSet = conditionalFormat.iconSet!;
// Set conditions for IconCriteria.
iconSet.iconSet = ExcelIconSetType.threeFlags;

final IconConditionValue iconValue1 = iconSet.iconCriteria[0] as IconConditionValue;
iconValue1.iconSet = ExcelIconSetType.fiveBoxes;
iconValue1.index = 3;
iconValue1.type = ConditionValueType.percent;
iconValue1.value = '25';
iconValue1.operator = ConditionalFormatOperator.greaterThan;

final IconConditionValue iconValue2 = iconSet.iconCriteria[1] as IconConditionValue;
iconValue2.iconSet = ExcelIconSetType.threeSigns;
iconValue2.index = 2;
iconValue2.type = ConditionValueType.percent;
iconValue2.value = '50';
iconValue2.operator = ConditionalFormatOperator.greaterThan;

final IconConditionValue iconValue3 = iconSet.iconCriteria[2] as IconConditionValue;
iconValue3.iconSet = ExcelIconSetType.fourRating;
iconValue3.index = 0;
iconValue3.type = ConditionValueType.percent;
iconValue3.value = '75';
iconValue3.operator = ConditionalFormatOperator.greaterThan;

final List<int> bytes = workbook.saveSync();
File('CustomIconSet.xlsx').writeAsBytes(bytes);
workbook.dispose();
Data Bars
Here, the values in each of the selected cells are compared, and a data bar is drawn in each cell representing the value of that cell relative to the other cells in the selected range. This bar provides a clear visual cue for users, making it easier to pick out larger and smaller values in a range. The DataBarAxisPosition values are automatic, middle, and none; the DataBarDirection values are leftToRight and rightToLeft.
This can be set and manipulated using the DataBar class as follows.
// Create data bars for the data in the specified range.
final ConditionalFormats conditionalFormats = sheet.getRangeByName('D1:D11').conditionalFormats;
final ConditionalFormat conditionalFormat = conditionalFormats.addCondition();
conditionalFormat.formatType = ExcelCFType.dataBar;
final DataBar dataBar = conditionalFormat.dataBar!;

// Set the constraints.
dataBar.minPoint.type = ConditionValueType.lowestValue;
dataBar.maxPoint.type = ConditionValueType.highestValue;

// Set the color for the DataBar using a hexadecimal value.
dataBar.barColor = '#FF7C80';

// Hide the data bar values.
dataBar.showValue = false;

// Show a border around the data bar.
dataBar.hasBorder = true;

// Disable the gradient fill.
dataBar.hasGradientFill = false;

// Set the bar axis position.
dataBar.dataBarAxisPosition = DataBarAxisPosition.middle;

// Set the bar direction.
dataBar.dataBarDirection = DataBarDirection.rightToLeft;

// Set the negative border color for the DataBar using a hexadecimal value.
dataBar.negativeBorderColor = '#ED7D31';

// Set the negative bar color for the DataBar using a hexadecimal value.
dataBar.negativeFillColor = '#013461';

// Set the bar axis color for the DataBar using a hexadecimal value.
dataBar.barAxisColor = '#FFDD12';

// Set the border color for the DataBar using a hexadecimal value.
dataBar.borderColor = '#12DD01';

// Set the bar color for the DataBar using RGB color values.
dataBar.barColorRgb = Color.fromARGB(255, 200, 13, 145);

// Set the negative border color for the DataBar using RGB color values.
dataBar.negativeBorderColorRgb = Color.fromARGB(255, 200, 130, 0);

// Set the negative bar color for the DataBar using RGB color values.
dataBar.negativeFillColorRgb = Color.fromARGB(230, 201, 230, 100);

// Set the bar axis color for the DataBar using RGB color values.
dataBar.barAxisColorRgb = Color.fromARGB(255, 134, 44, 224);

// Set the border color for the DataBar using RGB color values.
dataBar.borderColorRgb = Color.fromARGB(245, 45, 244, 230);
The following code example shows how to use the advanced conditional formats — Color Scale, Icon Set, and Data Bar — together in Flutter XlsIO.
// Create a new Excel Document.
final Workbook workbook = Workbook();

// Accessing sheet via index.
final Worksheet sheet = workbook.worksheets[0];

sheet.getRangeByName('A1').setText('Name');
sheet.getRangeByName('A2').setText('Andy');
sheet.getRangeByName('A3').setText('Jim');
sheet.getRangeByName('A4').setText('Zuke');
sheet.getRangeByName('A5').setText('Mark');
sheet.getRangeByName('A6').setText('Steve');
sheet.getRangeByName('A7').setText('Shan');
sheet.getRangeByName('A8').setText('John');
sheet.getRangeByName('A9').setText('Anne');
sheet.getRangeByName('A10').setText('Jessi');
sheet.getRangeByName('A11').setText('Olive');
sheet.getRangeByName('B1').setText('Mark-1');
sheet.getRangeByName('B2').setNumber(35);
sheet.getRangeByName('B3').setNumber(41);
sheet.getRangeByName('B4').setNumber(84);
sheet.getRangeByName('B5').setNumber(10);
sheet.getRangeByName('B6').setNumber(100);
sheet.getRangeByName('B7').setNumber(37);
sheet.getRangeByName('B8').setNumber(20);
sheet.getRangeByName('B9').setNumber(46);
sheet.getRangeByName('B10').setNumber(87);
sheet.getRangeByName('B11').setNumber(22);
sheet.getRangeByName('C1').setText('Mark-2');
sheet.getRangeByName('C2').setNumber(45);
sheet.getRangeByName('C3').setNumber(78);
sheet.getRangeByName('C4').setNumber(67);
sheet.getRangeByName('C5').setNumber(100);
sheet.getRangeByName('C6').setNumber(89);
sheet.getRangeByName('C7').setNumber(67);
sheet.getRangeByName('C8').setNumber(37);
sheet.getRangeByName('C9').setNumber(40);
sheet.getRangeByName('C10').setNumber(88);
sheet.getRangeByName('C11').setNumber(35);
sheet.getRangeByName('D1').setText('Mark-3');
sheet.getRangeByName('D2').setNumber(39);
sheet.getRangeByName('D3').setNumber(78);
sheet.getRangeByName('D4').setNumber(22);
sheet.getRangeByName('D5').setNumber(89);
sheet.getRangeByName('D6').setNumber(54);
sheet.getRangeByName('D7').setNumber(94);
sheet.getRangeByName('D8').setNumber(48);
sheet.getRangeByName('D9').setNumber(65);
sheet.getRangeByName('D10').setNumber(15);
sheet.getRangeByName('D11').setNumber(70);

// Create color scales for the data in the specified range.
ConditionalFormats conditionalFormats =
      sheet.getRangeByName('B1:B11').conditionalFormats;
ConditionalFormat conditionalFormat = conditionalFormats.addCondition();
conditionalFormat.formatType = ExcelCFType.colorScale;
final ColorScale colorScale = conditionalFormat.colorScale!;

// Set a 3-color scale.
colorScale.setConditionCount(3);
// Set the format color for the color scale using a hexadecimal value.
colorScale.criteria[0].formatColor = '#2C36F6';
colorScale.criteria[0].type = ConditionValueType.lowestValue;
colorScale.criteria[0].value = '0';

// Set the format color for the color scale using RGB color values.
colorScale.criteria[1].formatColorRgb = Color.fromARGB(255, 200, 20, 100);
colorScale.criteria[1].type = ConditionValueType.percentile;
colorScale.criteria[1].value = '50';

// Set the format color for the color scale using a hexadecimal value.
colorScale.criteria[2].formatColor = '#F06506';
colorScale.criteria[2].type = ConditionValueType.highestValue;
colorScale.criteria[2].value = '0';

// Create icon sets for the data in the specified range.
conditionalFormats = sheet.getRangeByName('C1:C11').conditionalFormats;
conditionalFormat = conditionalFormats.addCondition();
conditionalFormat.formatType = ExcelCFType.iconSet;
final IconSet iconSet = conditionalFormat.iconSet!;

// Apply a three-symbol icon and hide the data in the specified range.
iconSet.iconSet = ExcelIconSetType.threeSymbols;
iconSet.iconCriteria[1].type = ConditionValueType.percent;
iconSet.iconCriteria[1].value = "40";
iconSet.iconCriteria[2].type = ConditionValueType.percent;
iconSet.iconCriteria[2].value = "80";
iconSet.showIconOnly = true;

// Create data bars for the data in the specified range.
conditionalFormats = sheet.getRangeByName('D1:D11').conditionalFormats;
conditionalFormat = conditionalFormats.addCondition();
conditionalFormat.formatType = ExcelCFType.dataBar;
final DataBar dataBar = conditionalFormat.dataBar!;

// Set the constraints.
dataBar.minPoint.type = ConditionValueType.lowestValue;
dataBar.maxPoint.type = ConditionValueType.highestValue;

// Set the color for the DataBar using RGB color values.
dataBar.barColorRgb = Color.fromARGB(255, 244, 180, 10);

// Hide the data bar values.
dataBar.showValue = false;

// save and dispose.
final List<int> bytes = workbook.saveSync();
File('ConditionalFormat.xlsx').writeAsBytes(bytes);
workbook.dispose();
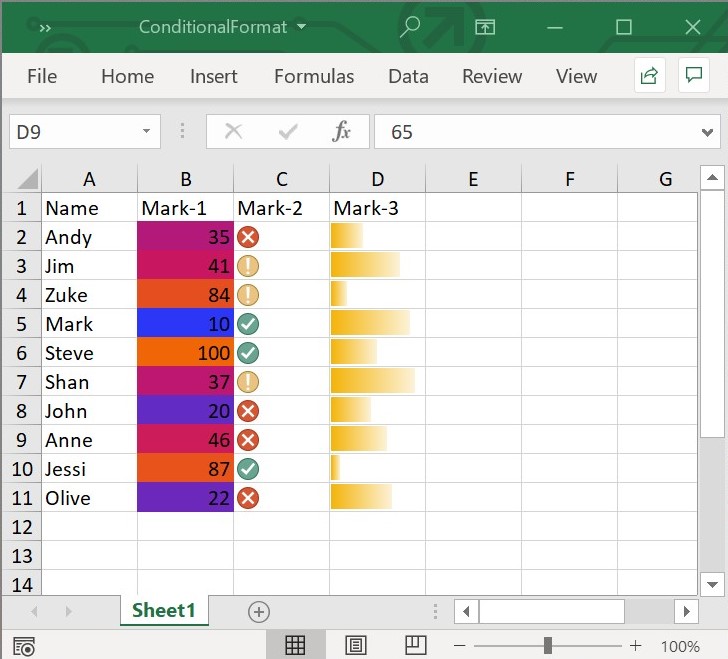
The following screenshot represents the generated Excel file with advanced conditional format in Flutter XlsIO.