Data Integration Platform Monitoring Solution
This user guide documentation covers Data Integration Platform monitoring solution. It also helps you to troubleshoot the workflow in case of failures.
Bulletin board
In Data Integration Platform, you can monitor the summary of all components by using Bulletin board. Bulletin board shows all processors with current running status alerts. You can configure bulletin level to manage log messages
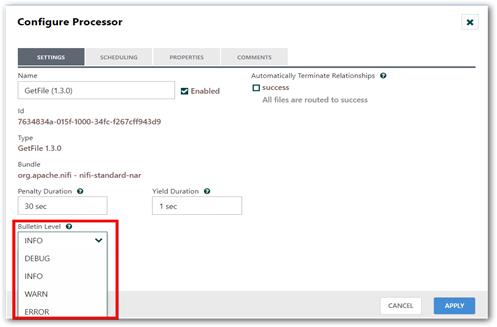
Example: If you set INFO in Bulletin Level dropdown box in any processor configuration, then the bulletin board will display info message such as running state about the configured processor in every scheduled interval of time
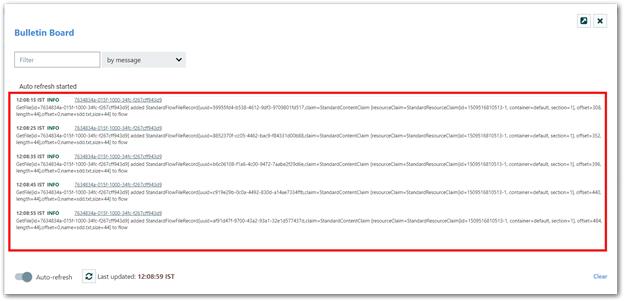
In Bulletin board, it has the following features:
-
You can navigate into any component from bulletin board by simply clicking its Component ID link.
-
You can identify the bulletin information based on scheduled interval time basis.
-
You can enable/disable the auto-refresh feature by using Auto-refreshtoggle button. Also, you can refresh bulletin message manually by using refresh icon.
-
You can also clear the old bulletin message by using Clear button in right bottom corner of Bulletin board dialog.
Reporting Task
Data Integration Platform has built-in features to provide statistical report about what is happening in its process. It can be configured in Controller Settings dialog. In Controller Settings dialog, select REPORTING TASKS tab. There will be two default reporting tasks (MonitorDiskUsage and MonitorMemory) will start to run when Data Integration service gets started and also you can add other required reporting tasks to monitor Data Integration application.
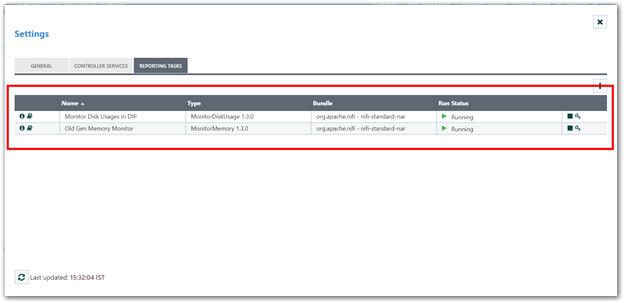
MonitorDiskUsage
Checks the amount of storage space available for the specified directory and warns (via a log message and a System-Level Bulletin) if the partition on which it lives exceeds some configurable threshold of storage space.
For configuration details, refer this link: https://help.syncfusion.com/data-integration/reportingtasks/monitordiskusage
MonitorMemory
Checks the amount of Java Heap available in the JVM Memory Pool. If the amount of space used exceeds some configurable threshold, will warn (via a log message and System-Level Bulletin) that the memory pool is exceeding this threshold.
For configuration details, refer this link: https://help.syncfusion.com/data-integration/reportingtasks/monitormemory
For remaining report task configuration details, refer Reporting Tasks topic in this link: https://help.syncfusion.com/data-integration/overview
Session View (Summary)
Data Integration Platform has option to view the session details of all workflow in each process group.
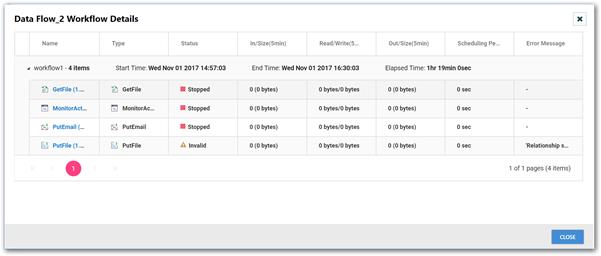
You can view the following details of a workflow
- Processor status
- Start time, end time and elapsed time
- Error message
- Scheduling period
- Input/output size of data
- Read/Write size of data
Also, it has option to navigate to required component using its component name.
Note
If workflow contains any Input or Output ports, navigation link will be ignored for those components.
View Session Details
-
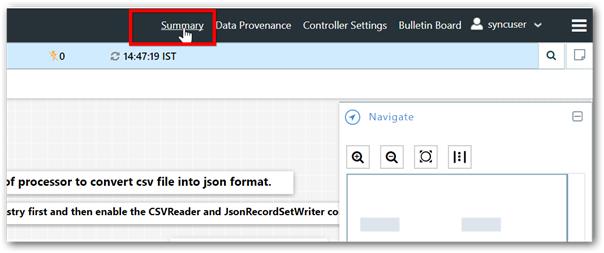
Click Summary tab in Data Integration home page.
-
Navigate to PROCESS GROUPS tab in Summary dialog and click informative icon of process group to view the session details.
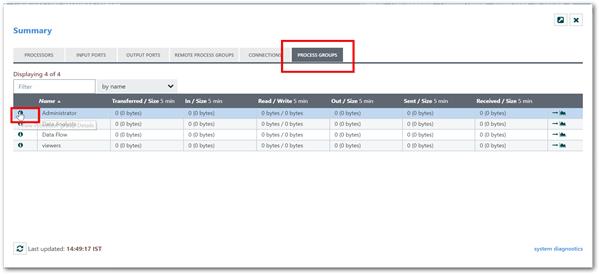
-
Workflow session details will be display as shown in below screenshot.
Data Integration Notification Service
You can also configure to send email notification to recipients when the application starts or stops unexpectedly.
Configuration
-
To setup email notification, you have to update two configurations file bootstrap.confand bootstrap-notification-services.xml.
-
Uncomment below lines in the bootstrap.confproperties file:

-
Uncomment below lines in bootstrap-notification-services.xmlfile and enter valid details to send email notification.
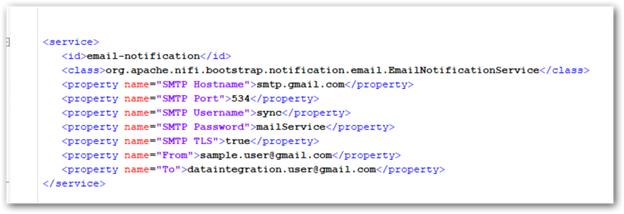
Once configuration completed, restart the Data Integration service to reflect the changes in hosted URL.

Workflow Monitoring
Data Integration Platform having built-in processor to send notification in Email and Microsoft Teams when you need to monitor a workflow or get mail status when workflow gets failed in any case.
PutEmail Processor
PutEmail processor is used to sends an e-mail to configured recipients for each incoming FlowFile.
For configuration details, refer the below link:
https://help.syncfusion.com/data-integration/processors/putemail
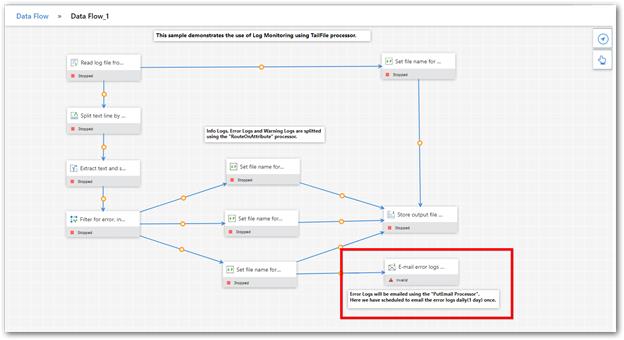
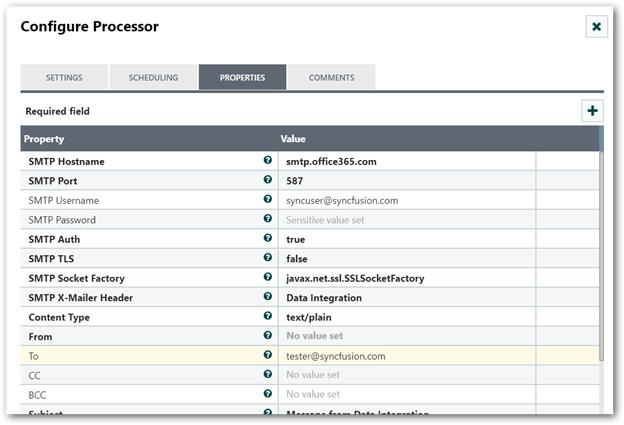
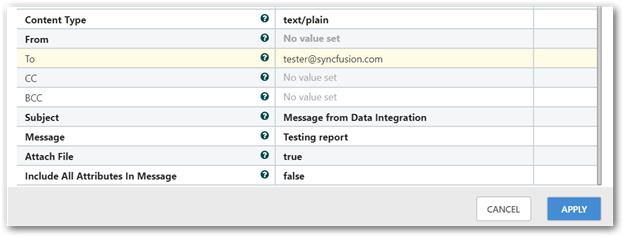
In above screenshot, created workflow to read log from Data Integration log file and used PutEmail processor to get only error log and send this details to the corresponding recipients in scheduled interval of time.
PutMicrosoftTeams Processor
You also configure PutMicrosoftTeams processor to send notification to your Microsoft Teams channel. You need to enter the required You hook URL of Teams channel and message in JSON format to send a message in Microsoft teams.
For configuration details, refer the below link:
https://help.syncfusion.com/data-integration/processors/putmicrosoftteams
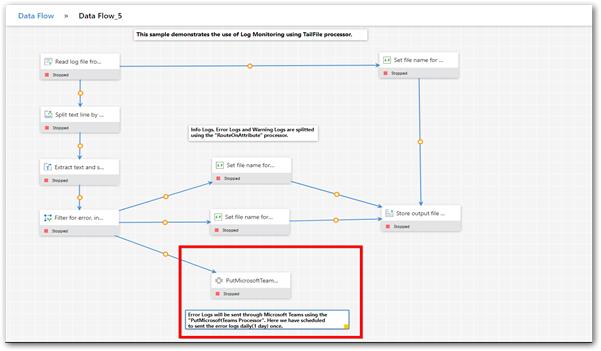
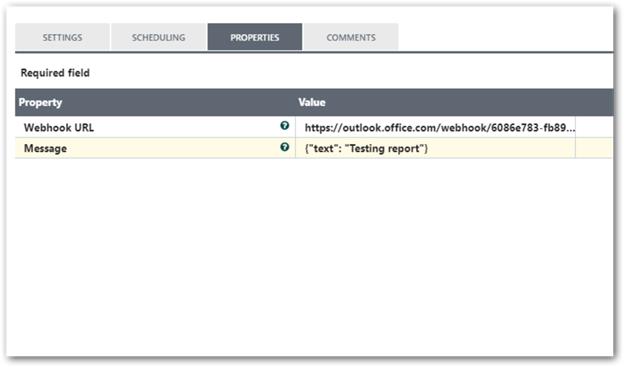
In above screenshot, created workflow to read Data Integration log file and used PutMicrosoftTeams processor with regular expression language to accept the incoming FlowFile attribute to get error log. Then it will send error log as message to Microsoft Teams.
MonitorActivity Processor
MonitorActivity processor monitors the flow for activity and sends out an indicator when the flow has not any data for some specified amount of time and again when the flow’s activity is restored.
For configuration details, refer the below URL:
https://help.syncfusion.com/data-integration/processors/monitoractivity
Example
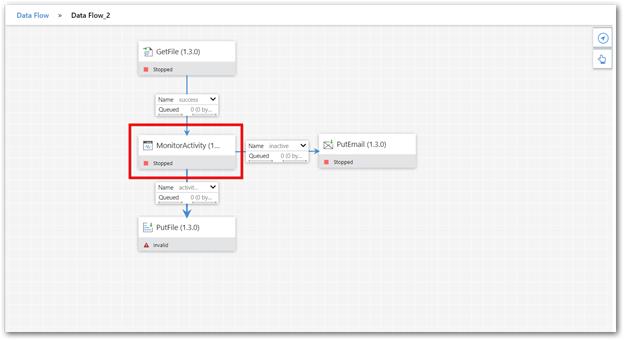
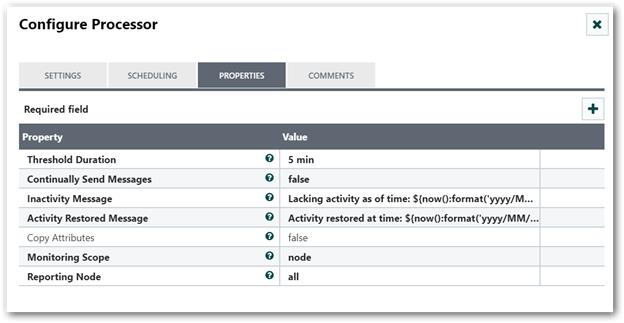
In above screenshot, created workflow to get file using GetFile processor. If FlowFile not generated within given threshold time, monitor Activity processor transfer FlowFile to inactive relationship. Therefore, PutEmail processor sends notification to corresponding recipients.