# Getting Started with React Charts
This section explains how to create a simple Chart component.
> **Ready to streamline your Syncfusion® React development?** Discover the full potential of Syncfusion® React components with Syncfusion® AI Coding Assistant. Effortlessly integrate, configure, and enhance your projects with intelligent, context-aware code suggestions, streamlined setups, and real-time insights—all seamlessly integrated into your preferred AI-powered IDEs like VS Code, Cursor, Syncfusion® CodeStudio and more. [Explore Syncfusion® AI Coding Assistant](https://ej2.syncfusion.com/react/documentation/ai-coding-assistant/overview)
A quick video overview of the React Charts setup is available:
{% youtube "https://www.youtube.com/watch?v=w1xHn0CceqE" %}
{% tabcontents %}
{% tabcontent Syncfusion CLI %}
## Prerequisites
- [Node.js 24+](https://nodejs.org/en) (LTS recommended).
- Syncfusion CLI.
## Install the Syncfusion CLI
Install the Syncfusion CLI globally using the following command:
{% tabs %}
{% highlight bash tabtitle="npm" %}
npm install -g @syncfusion/syncfusion-cli
{% endhighlight %}
{% endtabs %}
## Set up the Vite project using Syncfusion CLI
You can create a React Vite application using the Syncfusion CLI. The CLI provides two ways to create a project:
### Non-interactive mode
Non-interactive mode allows you to create a project directly using a single command with the required command-line arguments.
{% tabs %}
{% highlight bash tabtitle="CMD" %}
sf new my-chart-app --framework react --type ts --template chart
{% endhighlight %}
{% endtabs %}
In this mode, the project configuration is passed directly in the command. The above command creates a React Vite application configured with the Syncfusion® `Chart` component.
### Interactive mode
Interactive mode guides you through the project creation process with step-by-step prompts.
{% tabs %}
{% highlight bash tabtitle="CMD" %}
sf
{% endhighlight %}
{% endtabs %}
When you run the `sf` command, the CLI prompts you to select the required project configuration. To create a React Vite application with the Syncfusion® `Chart` component, select the following options:
{% tabs %}
{% highlight bash tabtitle="CMD" %}
√ Project name? ... my-chart-app
√ Choose Framework: » React
√ Choose Build Tool: » Vite
√ Choose Language: » Typescript
√ Choose Template: » Chart
√ Choose Theme: » Material3
√ Choose Style Format: » CSS
√ Would you like to integrate the Syncfusion MCP Server (AI Assistant) into this project? ... no
√ Would you like to install Syncfusion Component Skills for AI-powered development? ... no
√ Install dependencies and start app now? ... no
{% endhighlight %}
{% endtabs %}
The above selections generate a React Vite application configured with the Syncfusion® `Chart` component. You can choose different values for language, theme, style format, MCP setup, and skills installation based on your project requirements.
The Syncfusion® CLI creates the project with a predefined template. After the project is generated, you can customize or replace the component code based on your application requirements.
## Run the project
Once the project is created, navigate to the project directory and run the following commands in your terminal.
{% tabs %}
{% highlight bash tabtitle="CMD" %}
cd my-chart-app
npm install
npm run dev
{% endhighlight %}
{% endtabs %}
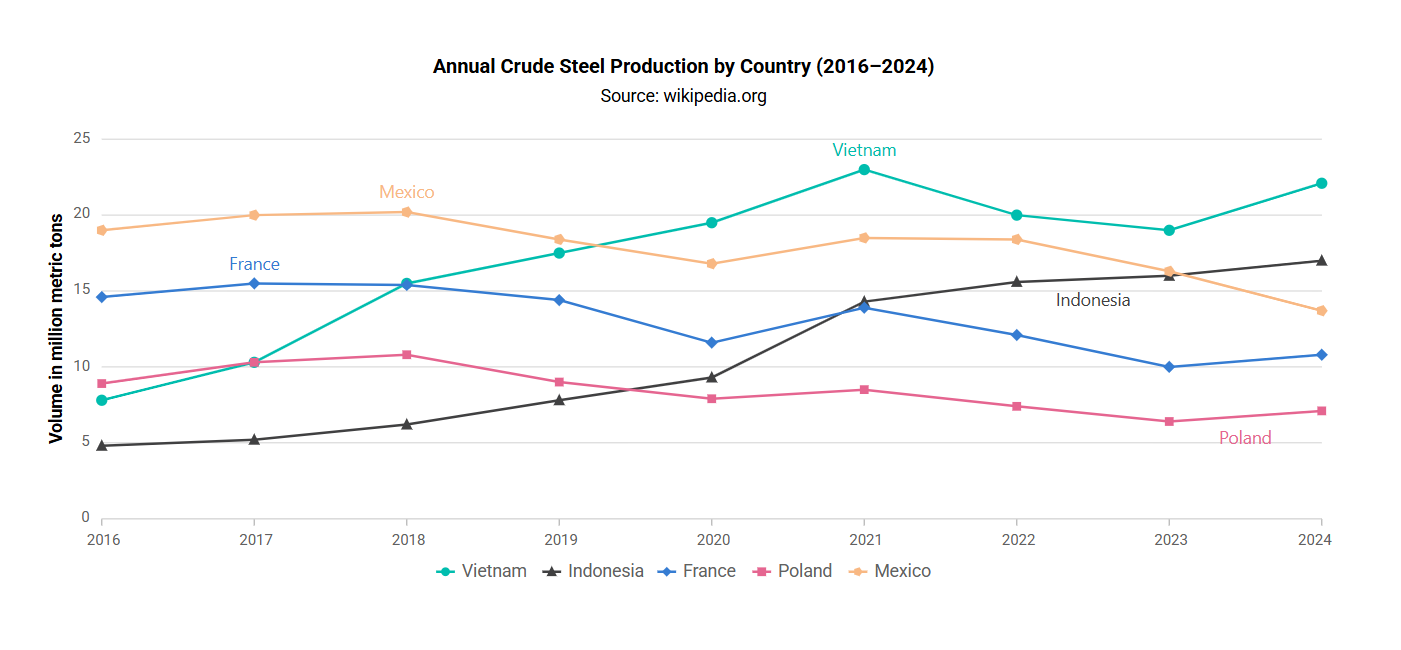
The output will appear as follows:
{% endtabcontent %}
{% tabcontent Vite CLI %}
## Prerequisites
Before getting started, ensure that your development environment meets the [system requirements for Syncfusion React UI components](https://ej2.syncfusion.com/react/documentation/system-requirement). That page documents the supported React, Node.js, and npm versions, and includes the React-version compatibility table for Syncfusion React components.
## Before You Begin
This guide uses the React application structure generated by Vite with the TypeScript template. The following files are part of that scaffold and work together as follows:
* `src/App.tsx` — Defines the root React component that hosts the Chart component. This is the only file edited in this guide.
* `src/main.tsx` — Application entry point that renders `App` into the `#root` element defined in `index.html`.
* `index.html` — Root HTML file that contains the `#root` container element used to mount the React application.
> **Note:** In a Vite React TypeScript application, the root component is commonly generated as `src/App.tsx`. If your application uses JavaScript, the equivalent file is typically `src/App.jsx`.
> **Note:** This guide uses the TypeScript template for better type checking with Chart models.
## Installation and configuration
> **Note:** As an alternative, you can create a React application using [`create-react-app`](https://github.com/facebook/create-react-app). For detailed instructions, refer to this [documentation](https://ej2.syncfusion.com/react/documentation/getting-started/create-app).
### Step 1: Create a React application with Vite
Use [Vite](https://vitejs.dev/) to create and manage React applications. Vite provides a fast development environment and optimized builds for modern React applications. Syncfusion® React documentation also recommends Vite for setting up React applications.
Start by opening a terminal on your system **(Command Prompt, PowerShell, or Terminal)**. You may work from the default C: drive location or create a new folder and open the terminal in it.
### Step 2: Create a React application
Create a new React application using the below command.
```bash
npm create vite@latest my-chart-app -- --template react-ts
```
If Vite prompts you to install dependencies and start the project immediately, choose **No**. The Syncfusion package is installed in a later step.
Navigate to the project folder:
```bash
cd my-chart-app
```
Install the application dependencies:
```bash
npm install
```
> **Note:** If you prefer JavaScript instead of TypeScript, create the application using `npm create vite@latest my-chart-app -- --template react`.
### Step 3: Install the Syncfusion® React Chart package
All Syncfusion Essential® JS 2 packages are published to the [npm registry](https://www.npmjs.com/~syncfusionorg).
Install the React Chart package using the following command:
```bash
npm install @syncfusion/ej2-react-charts
```
> Installing `@syncfusion/ej2-react-charts` automatically pulls in the required peer dependencies (for example, `@syncfusion/ej2-base` and `@syncfusion/ej2-charts`).
After the install completes, run `npm install` once more if the package is not yet listed in `package.json`. Then open the project in your IDE to continue with the next step.
### Step 4: Add the Chart component to the project
Add the Chart component to `src/App.tsx` using the following code.
{% tabs %}
{% highlight ts tabtitle="~/src/App.tsx" %}
import { ChartComponent } from '@syncfusion/ej2-react-charts';
function App() {
return ();
}
export default App;
{% endhighlight %}
{% endtabs %}
> **Note:** Running `npm run dev` ([Step 7](#step-7-run-the-application)) at this point renders an empty chart area. Continue with the next steps to inject modules, add data, and configure a series so the chart can render the data.
### Step 5: Inject required modules
Chart features are delivered as separate modules and must be explicitly injected. The `Inject` component takes a `services` array that registers the modules the Chart component is allowed to use; injecting only the modules you need keeps the bundle small. Here, the `LineSeries` and `Category` modules are used to render monthly sales data:
* `LineSeries` — Inject this module into `services` to render a line series.
* `Category` — Inject this module into `services` to enable the category axis.
Import the modules from the Chart package and register them through the `Inject` component as follows.
{% tabs %}
{% highlight ts tabtitle="~/src/App.tsx" %}
import { ChartComponent, LineSeries, Category, Inject } from '@syncfusion/ej2-react-charts';
function App() {
return
;
}
export default App;
{% endhighlight %}
{% endtabs %}
**Note:** At this stage, no series are rendered because the Chart component has not yet been configured with a data source.
### Step 6: Populate the Chart with data
Chart data should be provided as a JSON array in the following format. You can define the data in the same `src/App.tsx` file or place it in a separate file (for example, `src/datasource.ts`) and import it into `App.tsx`.
{% tabs %}
{% highlight ts tabtitle="~/src/datasource.ts" %}
export const data: Object[] = [
{ month: 'Jan', sales: 35 }, { month: 'Feb', sales: 28 },
{ month: 'Mar', sales: 34 }, { month: 'Apr', sales: 32 },
{ month: 'May', sales: 40 }, { month: 'Jun', sales: 32 },
{ month: 'Jul', sales: 35 }, { month: 'Aug', sales: 55 },
{ month: 'Sep', sales: 38 }, { month: 'Oct', sales: 30 },
{ month: 'Nov', sales: 25 }, { month: 'Dec', sales: 32 }
];
{% endhighlight %}
{% endtabs %}
After defining the required data set, bind the data to the Chart component in the `SeriesDirective` tag. The following code snippet demonstrates the complete configuration required to render a basic chart.
{% tabs %}
{% highlight js tabtitle="index.jsx" %}
{% endhighlight %}
{% highlight ts tabtitle="index.tsx" %}
{% endhighlight %}
{% endtabs %}
### Step 7: Run the application
Run the application using the following command:
```bash
npm run dev
```
Open the generated local URL (for example, `localhost:5173/`) from terminal in the browser. The application displays the chart as shown below:

{% endtabcontent %}
{% endtabcontents %}
## Troubleshooting
Use the following guidance to resolve common issues when getting started with the React Chart component.
- **Chart does not render (blank page)**
- Verify that `index.html` contains a container with `id="root"`, and that `main.tsx` (or `main.jsx`) calls `createRoot(document.getElementById("root")!).render()`.
- Run `npm install` again to ensure all peer dependencies are installed.
- **Chart area renders but no series is displayed**
- Confirm that the required series module (for example, `LineSeries` or `ColumnSeries`) and axis module (for example, `Category` or `DateTime`) are listed in the `services` array of the `Inject` component.
- Confirm that `` is wrapped in a `` and that `dataSource`, `xName`, `yName`, and `type` are set.
- **Series data is plotted in the wrong order or with wrong labels**
- Check that the property names passed to `xName` and `yName` exactly match the keys in the `dataSource` array (the comparison is case-sensitive).
- If the `x` field holds `Date` values, set the [`valueType`](https://ej2.syncfusion.com/react/documentation/api/chart/axisModel#valuetype) of `primaryXAxis` to `DateTime`; for string categories use `Category`.
- **`Module not found: Can't resolve '@syncfusion/ej2-react-charts'`**
- The package was not installed in the current project. Run `npm install @syncfusion/ej2-react-charts` from the project root.
- **Tooltip, legend, or data label is not visible after enabling it**
- Confirm that the corresponding module (for example, `Tooltip`, `Legend`, `DataLabel`) is included in the `services` array of the `Inject` component.
## See also
Explore the following related topics:
- [Chart Series Types](./chart-series)
- [Chart Data Markers](./data-markers)
- [Chart Tooltip](./tool-tip)
- [Chart Legend](./legend)
- [Chart Data Labels](./data-labels)
- [Chart Appearance](./chart-appearance)
- [Next.js Getting Started](./nextjs-getting-started)
- [Preact Getting Started](./preact)