---
layout: post
title: Markers in Blazor Charts Component | Syncfusion®
description: Checkout and learn here all the features about the available Markers in Blazor Charts component and much more.
platform: chart-sdk
control: Chart
documentation: ug
---
# Markers in Blazor Charts Component
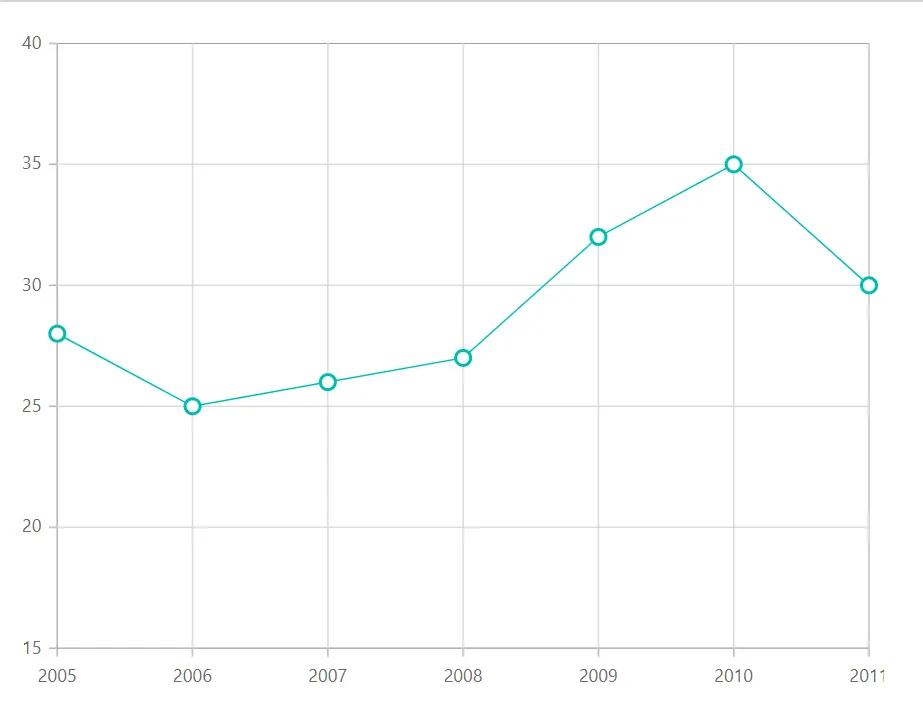
[Data markers](https://help.syncfusion.com/cr/blazor/Syncfusion.Blazor.Charts.ChartCommonMarker.html) are used to provide information about the data points in a series. Each data point can be adorned with a shape.
## Markers
Markers can be added to the points by enabling the [Visible](https://help.syncfusion.com/cr/blazor/Syncfusion.Blazor.Charts.ChartCommonMarker.html#Syncfusion_Blazor_Charts_ChartCommonMarker_Visible) property to **true** of [ChartMarker](https://help.syncfusion.com/cr/blazor/Syncfusion.Blazor.Charts.ChartMarker.html).
```cshtml
@using Syncfusion.Blazor.Charts
@code{
public class ChartData
{
public double X { get; set; }
public double Y { get; set; }
}
public List ConsumerReports = new List
{
new ChartData{ X= 2005, Y= 28 },
new ChartData{ X= 2006, Y= 25 },
new ChartData{ X= 2007, Y= 26 },
new ChartData{ X= 2008, Y= 27 },
new ChartData{ X= 2009, Y= 32 },
new ChartData{ X= 2010, Y= 35 },
new ChartData{ X= 2011, Y= 30 }
};
}
```
## Shape
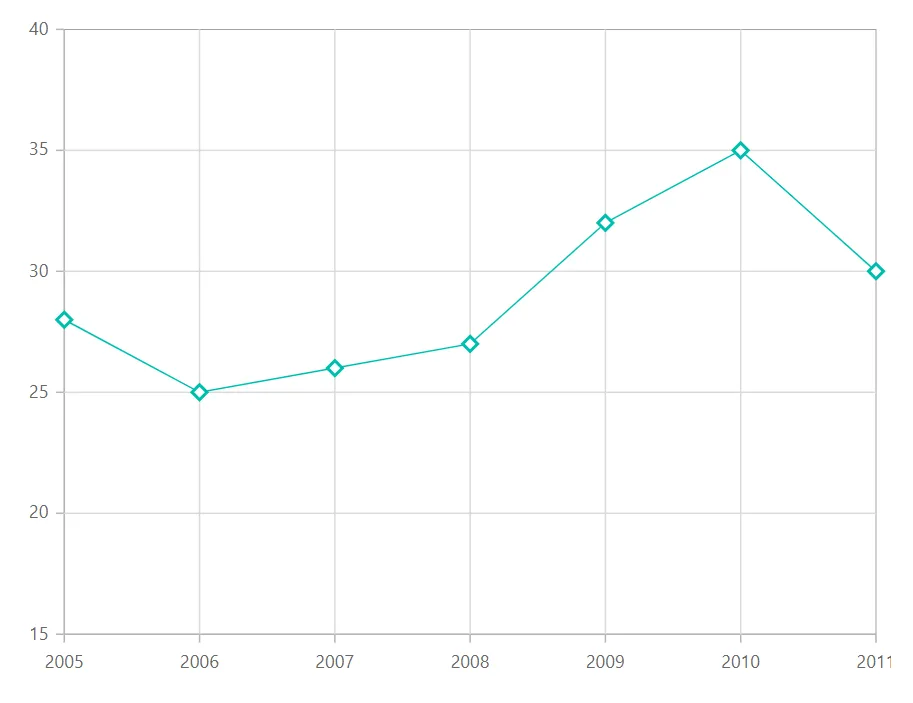
Markers can be assigned with different shapes such as [Rectangle](https://help.syncfusion.com/cr/blazor/Syncfusion.Blazor.Charts.ChartShape.html#Syncfusion_Blazor_Charts_ChartShape_Rectangle), [Circle](https://help.syncfusion.com/cr/blazor/Syncfusion.Blazor.Charts.ChartShape.html#Syncfusion_Blazor_Charts_ChartShape_Circle), [Diamond](https://help.syncfusion.com/cr/blazor/Syncfusion.Blazor.Charts.ChartShape.html#Syncfusion_Blazor_Charts_ChartShape_Diamond) etc. using the [Shape](https://help.syncfusion.com/cr/blazor/Syncfusion.Blazor.Charts.ChartCommonMarker.html#Syncfusion_Blazor_Charts_ChartCommonMarker_Shape) property.
```cshtml
@using Syncfusion.Blazor.Charts
@code{
public class ChartData
{
public double X { get; set; }
public double Y { get; set; }
}
public List ConsumerReports = new List
{
new ChartData{ X= 2005, Y= 28 },
new ChartData{ X= 2006, Y= 25 },
new ChartData{ X= 2007, Y= 26 },
new ChartData{ X= 2008, Y= 27 },
new ChartData{ X= 2009, Y= 32 },
new ChartData{ X= 2010, Y= 35 },
new ChartData{ X= 2011, Y= 30 }
};
}
```
## Auto marker shape
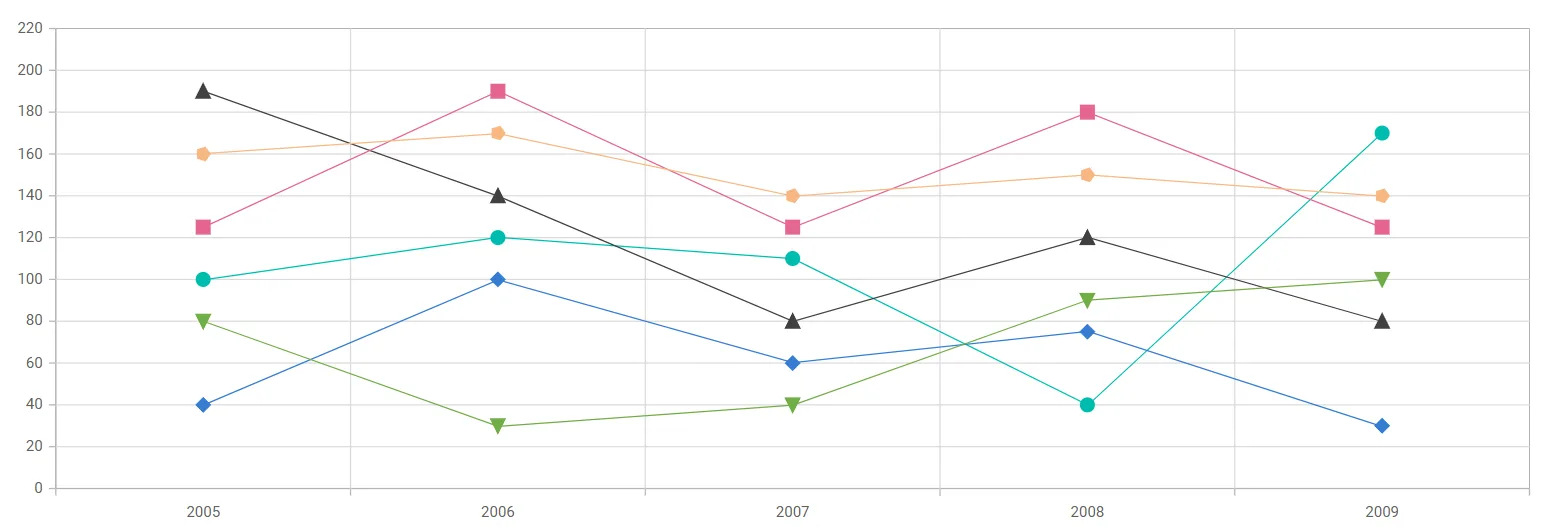
By default, the chart [marker shape](https://help.syncfusion.com/cr/blazor/Syncfusion.Blazor.Charts.ChartCommonMarker.html#Syncfusion_Blazor_Charts_ChartCommonMarker_Shape) is set to [Auto](https://help.syncfusion.com/cr/blazor/Syncfusion.Blazor.Charts.ChartShape.html#Syncfusion_Blazor_Charts_ChartShape_Auto). When **Auto** is set and marker is enabled in the chart at the same time, each series is rendered with a unique marker shape.
```cshtml
@using Syncfusion.Blazor.Charts
@code {
public class ChartData
{
public DateTime X { get; set; }
public double Y { get; set; }
public double Y1 { get; set; }
public double Y2 { get; set; }
public double Y3 { get; set; }
public double Y4 { get; set; }
public double Y5 { get; set; }
public double Y6 { get; set; }
}
public List ConsumerReports = new List
{
new ChartData{ X= new DateTime(2005,01,01), Y1 = 100, Y2 = 190, Y3 = 40, Y4 = 125, Y5 = 160, Y6 = 80 },
new ChartData{ X= new DateTime(2006,01,01), Y1 = 120, Y2 = 140, Y3 = 100, Y4 = 190, Y5 = 170, Y6 = 30 },
new ChartData{ X= new DateTime(2007,01,01), Y1 = 110, Y2 = 80, Y3 = 60, Y4 = 125, Y5 = 140, Y6 = 40 },
new ChartData{ X= new DateTime(2008,01,01), Y1 = 40, Y2 = 120, Y3 = 75, Y4 = 180, Y5 = 150, Y6 = 90 },
new ChartData{ X= new DateTime(2009,01,01), Y1 = 170, Y2 = 80, Y3 = 30, Y4 = 125, Y5 = 140, Y6 = 100 },
};
}
```
## Images
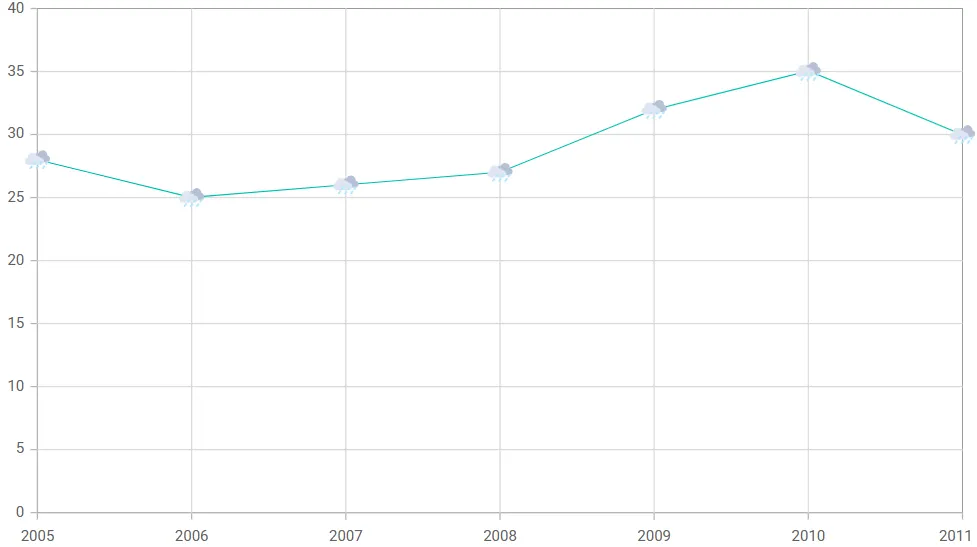
Apart from shapes, one can also add custom images to mark the data point using the [ImageUrl](https://help.syncfusion.com/cr/blazor/Syncfusion.Blazor.Charts.ChartCommonMarker.html#Syncfusion_Blazor_Charts_ChartCommonMarker_ImageUrl) property by specifying [Image](https://help.syncfusion.com/cr/blazor/Syncfusion.Blazor.Charts.ChartShape.html#Syncfusion_Blazor_Charts_ChartShape_Image) shape for marker.
```cshtml
@using Syncfusion.Blazor.Charts
@code{
public class ChartData
{
public double X { get; set; }
public double Y { get; set; }
}
public List ConsumerReports = new List
{
new ChartData{ X= 2005, Y= 28 },
new ChartData{ X= 2006, Y= 25 },
new ChartData{ X= 2007, Y= 26 },
new ChartData{ X= 2008, Y= 27 },
new ChartData{ X= 2009, Y= 32 },
new ChartData{ X= 2010, Y= 35 },
new ChartData{ X= 2011, Y= 30 }
};
}
```
## Fill marker with series color
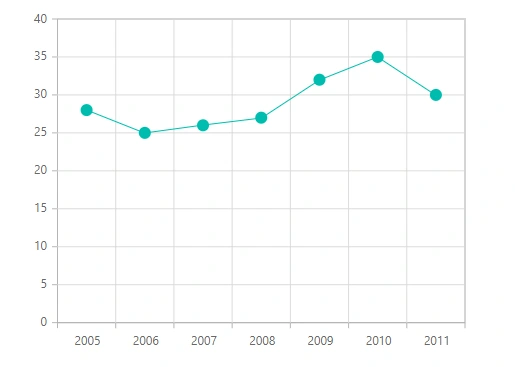
Marker can be filled with the series color by setting [IsFilled](https://help.syncfusion.com/cr/blazor/Syncfusion.Blazor.Charts.ChartCommonMarker.html#Syncfusion_Blazor_Charts_ChartCommonMarker_IsFilled) property to **true** of [ChartMarker](https://help.syncfusion.com/cr/blazor/Syncfusion.Blazor.Charts.ChartMarker.html).
```cshtml
@using Syncfusion.Blazor.Charts
@code{
public class ChartData
{
public double X { get; set; }
public double Y { get; set; }
}
public List ConsumerReports = new List
{
new ChartData{ X= 2005, Y= 28 },
new ChartData{ X= 2006, Y= 25 },
new ChartData{ X= 2007, Y= 26 },
new ChartData{ X= 2008, Y= 27 },
new ChartData{ X= 2009, Y= 32 },
new ChartData{ X= 2010, Y= 35 },
new ChartData{ X= 2011, Y= 30 }
};
}
```
## Customization
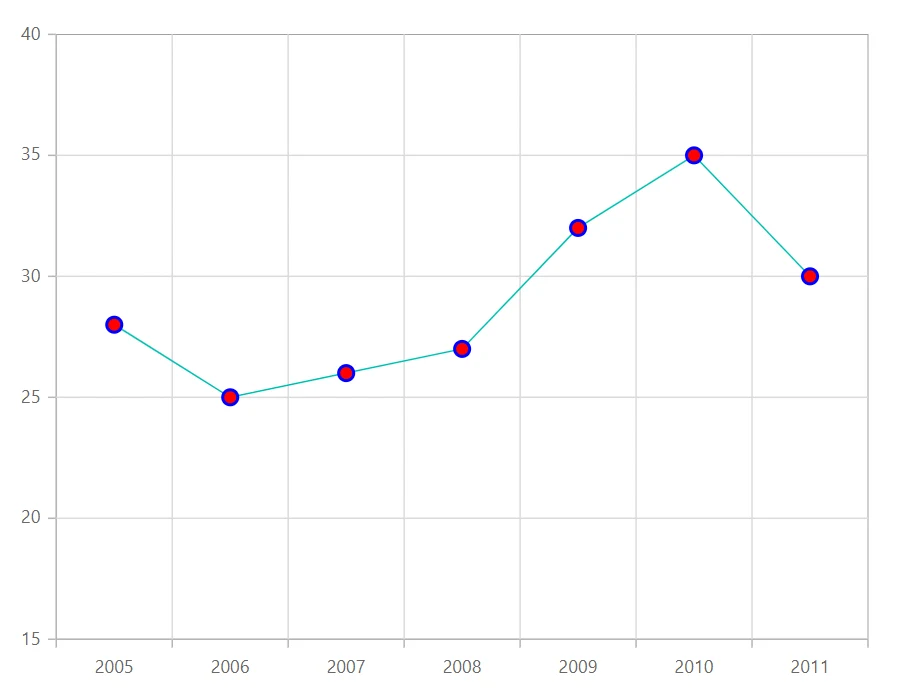
Markers color can be customized using [Fill](https://help.syncfusion.com/cr/blazor/Syncfusion.Blazor.Charts.ChartCommonMarker.html#Syncfusion_Blazor_Charts_ChartCommonMarker_Fill) property and the border color and width can be customized based on the specified value in [ChartMarkerBorder](https://help.syncfusion.com/cr/blazor/Syncfusion.Blazor.Charts.ChartMarkerBorder.html).
```cshtml
@using Syncfusion.Blazor.Charts
@code{
public class ChartData
{
public double X { get; set; }
public double Y { get; set; }
}
public List ConsumerReports = new List
{
new ChartData{ X= 2005, Y= 28 },
new ChartData{ X= 2006, Y= 25 },
new ChartData{ X= 2007, Y= 26 },
new ChartData{ X= 2008, Y= 27 },
new ChartData{ X= 2009, Y= 32 },
new ChartData{ X= 2010, Y= 35 },
new ChartData{ X= 2011, Y= 30 }
};
}
```
N> Refer to the [Blazor Charts](https://www.syncfusion.com/blazor-components/blazor-charts) feature tour page for its groundbreaking feature representations and also explore the [Blazor Chart Example](https://blazor.syncfusion.com/demos/chart/line?theme=bootstrap5) to know various chart types and how to represent time-dependent data, showing trends at equal intervals.
## See also
* [Tooltip](./tool-tip)
* [Legend](./legend)