---
layout: post
title: Appearance in Blazor Charts Component | Syncfusion®
description: Checkout and learn here all the features about Appearance Customization in Blazor Charts component and much more.
platform: chart-sdk
control: Chart
documentation: ug
---
# Appearance in Blazor Charts Component
## Custom color palette
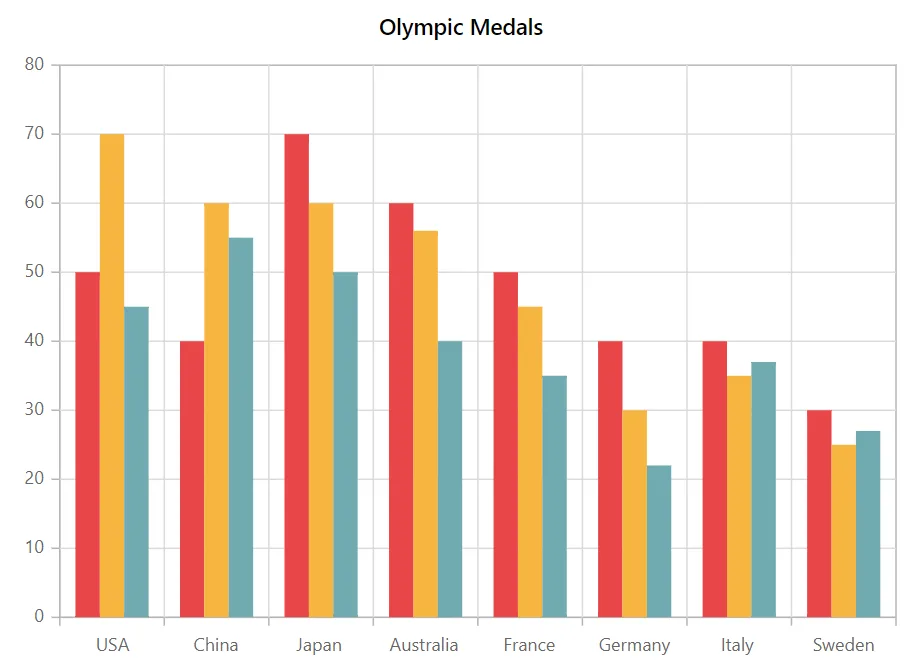
The default color of series or points can be changed by providing a custom color palette to the [Palettes](https://help.syncfusion.com/cr/blazor/Syncfusion.Blazor.Charts.SfChart.html#Syncfusion_Blazor_Charts_SfChart_Palettes) property.
```cshtml
@using Syncfusion.Blazor.Charts
@code{
public class ChartData
{
public string Country { get; set; }
public double Gold { get; set; }
public double Silver { get; set; }
public double Bronze { get; set; }
}
public List MedalDetails = new List
{
new ChartData{ Country= "USA", Gold=50, Silver=70, Bronze=45 },
new ChartData{ Country="China", Gold=40, Silver= 60, Bronze=55 },
new ChartData{ Country= "Japan", Gold=70, Silver= 60, Bronze=50 },
new ChartData{ Country= "Australia", Gold=60, Silver= 56, Bronze=40 },
new ChartData{ Country= "France", Gold=50, Silver= 45, Bronze=35 },
new ChartData{ Country= "Germany", Gold=40, Silver=30, Bronze=22 },
new ChartData{ Country= "Italy", Gold=40, Silver=35, Bronze=37 },
new ChartData{ Country= "Sweden", Gold=30, Silver=25, Bronze=27 }
};
public String[] palettes = new String[] { "#E94649", "#F6B53F", "#6FAAB0" };
}
```
## Chart customization
### Chart background and border
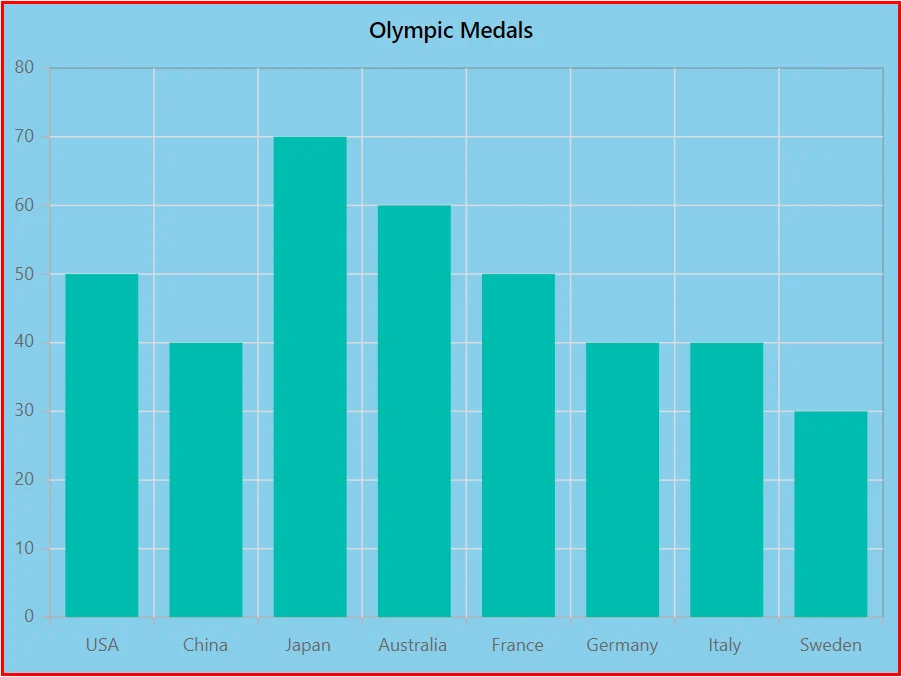
The chart's background color can be customized using the [Background](https://help.syncfusion.com/cr/blazor/Syncfusion.Blazor.Charts.SfChart.html#Syncfusion_Blazor_Charts_SfChart_Background) property and the border color and width can be customized based on the specified value in [ChartBorder](https://help.syncfusion.com/cr/blazor/Syncfusion.Blazor.Charts.ChartBorder.html).
```cshtml
@using Syncfusion.Blazor.Charts
@code{
public class ChartData
{
public string Country { get; set; }
public double Gold { get; set; }
}
public List MedalDetails = new List
{
new ChartData{ Country= "USA", Gold=50 },
new ChartData{ Country="China", Gold=40 },
new ChartData{ Country= "Japan", Gold=70 },
new ChartData{ Country= "Australia", Gold=60},
new ChartData{ Country= "France", Gold=50 },
new ChartData{ Country= "Germany", Gold=40 },
new ChartData{ Country= "Italy", Gold=40 },
new ChartData{ Country= "Sweden", Gold=30 }
};
}
```
### Chart margin
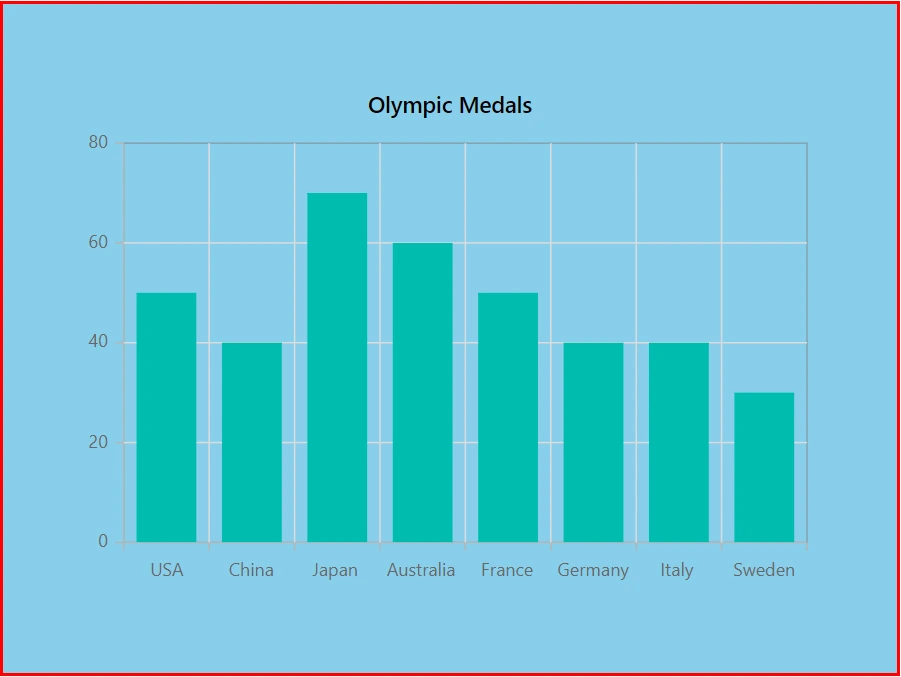
The chart's margin from its container can be customized using the [ChartMargin](https://help.syncfusion.com/cr/blazor/Syncfusion.Blazor.Charts.ChartMargin.html).
```cshtml
@using Syncfusion.Blazor.Charts
@code{
public class ChartData
{
public string Country { get; set; }
public double Gold { get; set; }
}
public List MedalDetails = new List
{
new ChartData{ Country= "USA", Gold=50 },
new ChartData{ Country="China", Gold=40 },
new ChartData{ Country= "Japan", Gold=70 },
new ChartData{ Country= "Australia", Gold=60},
new ChartData{ Country= "France", Gold=50 },
new ChartData{ Country= "Germany", Gold=40 },
new ChartData{ Country= "Italy", Gold=40 },
new ChartData{ Country= "Sweden", Gold=30 }
};
}
```
### Chart area customization
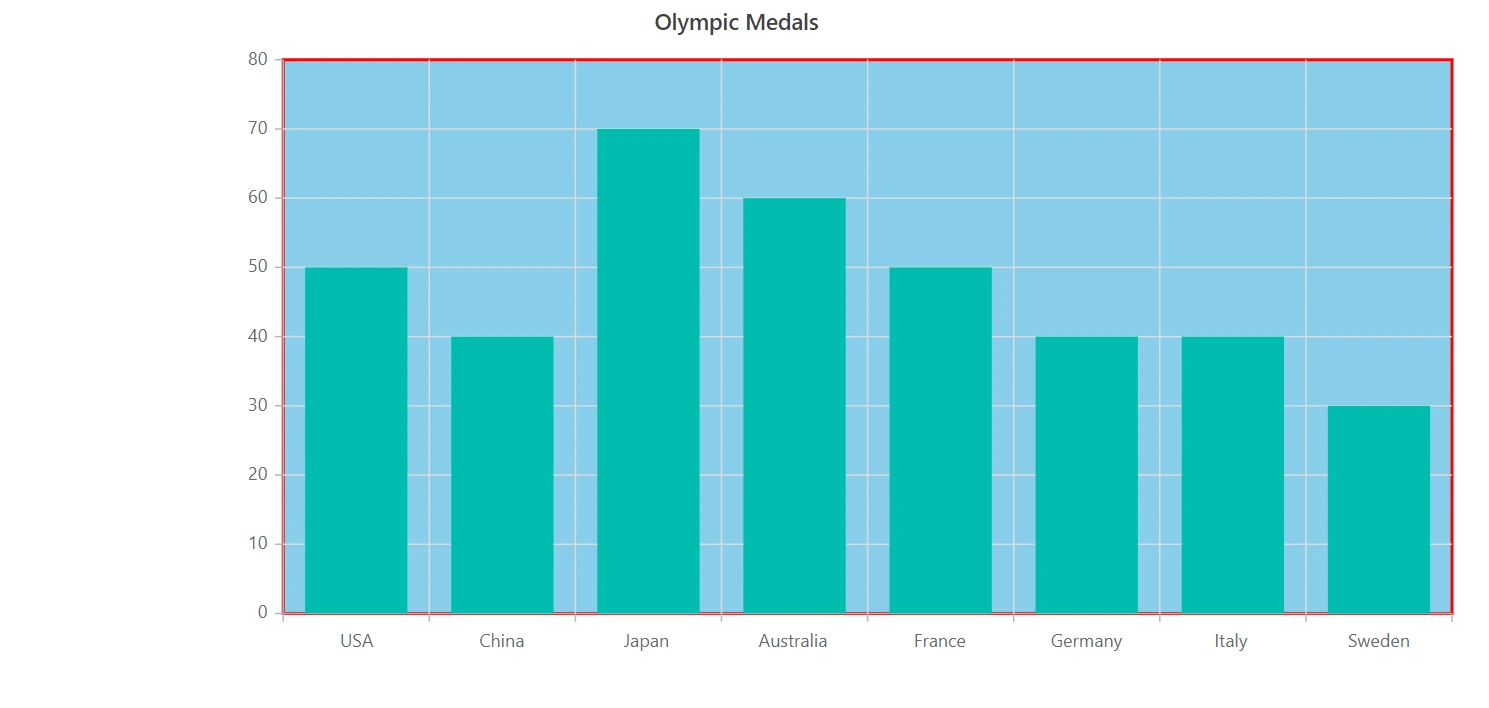
Using [Background](https://help.syncfusion.com/cr/blazor/Syncfusion.Blazor.Charts.ChartArea.html#Syncfusion_Blazor_Charts_ChartArea_Background) and [ChartAreaBorder](https://help.syncfusion.com/cr/blazor/Syncfusion.Blazor.Charts.ChartAreaBorder.html) properties, you can change the background color and border of the chart area. Width for the chart area can be customized using [Width](https://help.syncfusion.com/cr/blazor/Syncfusion.Blazor.Charts.ChartArea.html#Syncfusion_Blazor_Charts_ChartArea_Width) property.
```cshtml
@using Syncfusion.Blazor.Charts
@code{
public class ChartData
{
public string Country { get; set; }
public double Gold { get; set; }
}
public List MedalDetails = new List
{
new ChartData{ Country= "USA", Gold=50 },
new ChartData{ Country="China", Gold=40 },
new ChartData{ Country= "Japan", Gold=70 },
new ChartData{ Country= "Australia", Gold=60},
new ChartData{ Country= "France", Gold=50 },
new ChartData{ Country= "Germany", Gold=40 },
new ChartData{ Country= "Italy", Gold=40 },
new ChartData{ Country= "Sweden", Gold=30 }
};
}
```
## Animation
The [Animation](https://help.syncfusion.com/cr/blazor/Syncfusion.Blazor.Charts.ChartSeries.html#Syncfusion_Blazor_Charts_ChartSeries_Animation) property allows to customize animation for a certain series. The [Enable](https://help.syncfusion.com/cr/blazor/Syncfusion.Blazor.Charts.StockChartCommonAnimation.html#Syncfusion_Blazor_Charts_StockChartCommonAnimation_Enable) property can be used to enable or disable the series animation. The duration of the animation is specified by [Duration](https://help.syncfusion.com/cr/blazor/Syncfusion.Blazor.Charts.StockChartCommonAnimation.html#Syncfusion_Blazor_Charts_StockChartCommonAnimation_Duration) property, and [Delay](https://help.syncfusion.com/cr/blazor/Syncfusion.Blazor.Charts.StockChartCommonAnimation.html#Syncfusion_Blazor_Charts_StockChartCommonAnimation_Delay) property allows to start the animation at a specific moment.
```cshtml
@using Syncfusion.Blazor.Charts
@code{
public class ChartData
{
public string Country { get; set; }
public double Gold { get; set; }
public double Silver { get; set; }
public double Bronze { get; set; }
}
public List MedalDetails = new List
{
new ChartData{ Country= "USA", Gold=50, Silver=70, Bronze=45 },
new ChartData{ Country="China", Gold=40, Silver= 60, Bronze=55 },
new ChartData{ Country= "Japan", Gold=70, Silver= 60, Bronze=50 },
new ChartData{ Country= "Australia", Gold=60, Silver= 56, Bronze=40 },
new ChartData{ Country= "France", Gold=50, Silver= 45, Bronze=35 },
new ChartData{ Country= "Germany", Gold=40, Silver=30, Bronze=22 },
new ChartData{ Country= "Italy", Gold=40, Silver=35, Bronze=37 },
new ChartData{ Country= "Sweden", Gold=30, Silver=25, Bronze=27 }
};
}
```
## Chart title
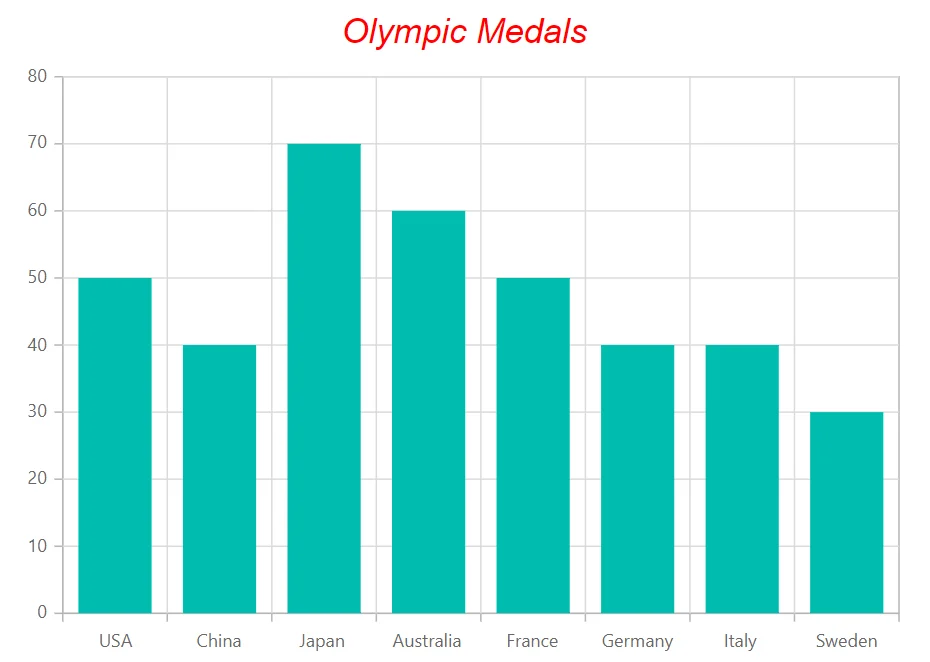
A chart title can be specified using the [Title](https://help.syncfusion.com/cr/blazor/Syncfusion.Blazor.Charts.SfChart.html#Syncfusion_Blazor_Charts_SfChart_Title) property to convey information about the displayed data.
```cshtml
@using Syncfusion.Blazor.Charts
@code{
public class ChartData
{
public string Country { get; set; }
public double Gold {get; set; }
}
public List MedalDetails = new List
{
new ChartData{ Country= "USA", Gold=50 },
new ChartData{ Country="China", Gold=40 },
new ChartData{ Country= "Japan", Gold=70 },
new ChartData{ Country= "Australia", Gold=60},
new ChartData{ Country= "France", Gold=50 },
new ChartData{ Country= "Germany", Gold=40 },
new ChartData{ Country= "Italy", Gold=40 },
new ChartData{ Country= "Sweden", Gold=30 }
};
}
```
### Title position
The [Position](https://help.syncfusion.com/cr/blazor/Syncfusion.Blazor.Charts.ChartTitleStyle.html#Syncfusion_Blazor_Charts_ChartTitleStyle_Position) property customizes the placement of the chart title. It supports the following options: [Right](https://help.syncfusion.com/cr/blazor/Syncfusion.Blazor.Charts.ChartTitlePosition.html#Syncfusion_Blazor_Charts_ChartTitlePosition_Right), [Left](https://help.syncfusion.com/cr/blazor/Syncfusion.Blazor.Charts.ChartTitlePosition.html#Syncfusion_Blazor_Charts_ChartTitlePosition_Left), [Bottom](https://help.syncfusion.com/cr/blazor/Syncfusion.Blazor.Charts.ChartTitlePosition.html#Syncfusion_Blazor_Charts_ChartTitlePosition_Bottom), [Top](https://help.syncfusion.com/cr/blazor/Syncfusion.Blazor.Charts.ChartTitlePosition.html#Syncfusion_Blazor_Charts_ChartTitlePosition_Top), and [Custom](https://help.syncfusion.com/cr/blazor/Syncfusion.Blazor.Charts.ChartTitlePosition.html#Syncfusion_Blazor_Charts_ChartTitlePosition_Custom), providing flexible title alignment based on layout requirements. By default, the chart title appears at the top of the chart.
N> The subtitle, which appears below the title, will also be positioned along with the title when the `Position` property is set.
```cshtml
@using Syncfusion.Blazor.Charts
@code{
public class ChartData
{
public string Country { get; set; }
public double Gold { get; set; }
}
public List MedalDetails = new List
{
new ChartData{ Country= "USA", Gold=50 },
new ChartData{ Country="China", Gold=40 },
new ChartData{ Country= "Japan", Gold=70 },
new ChartData{ Country= "Australia", Gold=60},
new ChartData{ Country= "France", Gold=50 },
new ChartData{ Country= "Germany", Gold=40 },
new ChartData{ Country= "Italy", Gold=40 },
new ChartData{ Country= "Sweden", Gold=30 }
};
}
```
{% previewsample "https://blazorplayground.syncfusion.com/embed/hthIjzjTrISHobHi?appbar=false&editor=false&result=true&errorlist=false&theme=bootstrap5" backgroundimage "[Position customization of title in Blazor Chart](images/appearance/blazor-chart-title-position.webp)" %}
When the `Position` is set to `Custom`, the title can be positioned anywhere on the chart using the [X](https://help.syncfusion.com/cr/blazor/Syncfusion.Blazor.Charts.ChartTitleStyle.html#Syncfusion_Blazor_Charts_ChartTitleStyle_X) and [Y](https://help.syncfusion.com/cr/blazor/Syncfusion.Blazor.Charts.ChartTitleStyle.html#Syncfusion_Blazor_Charts_ChartTitleStyle_Y) properties in [ChartTitleStyle](https://help.syncfusion.com/cr/blazor/Syncfusion.Blazor.Charts.ChartTitleStyle.html). This provides precise control over the title’s location, enabling customization to fit specific design or layout needs. The `X` and `Y` values specify the horizontal and vertical coordinates, respectively.
```cshtml
@using Syncfusion.Blazor.Charts
@code{
public class ChartData
{
public string Country { get; set; }
public double Gold { get; set; }
}
public List MedalDetails = new List
{
new ChartData{ Country= "USA", Gold=50 },
new ChartData{ Country="China", Gold=40 },
new ChartData{ Country= "Japan", Gold=70 },
new ChartData{ Country= "Australia", Gold=60},
new ChartData{ Country= "France", Gold=50 },
new ChartData{ Country= "Germany", Gold=40 },
new ChartData{ Country= "Italy", Gold=40 },
new ChartData{ Country= "Sweden", Gold=30 }
};
}
```
{% previewsample "https://blazorplayground.syncfusion.com/embed/BjLoXTtfLyEQbMWr?appbar=false&editor=false&result=true&errorlist=false&theme=bootstrap5" backgroundimage "[Custom position of title in Blazor Chart](images/appearance/blazor-chart-title-position-custom.webp)" %}
## Chart subtitle
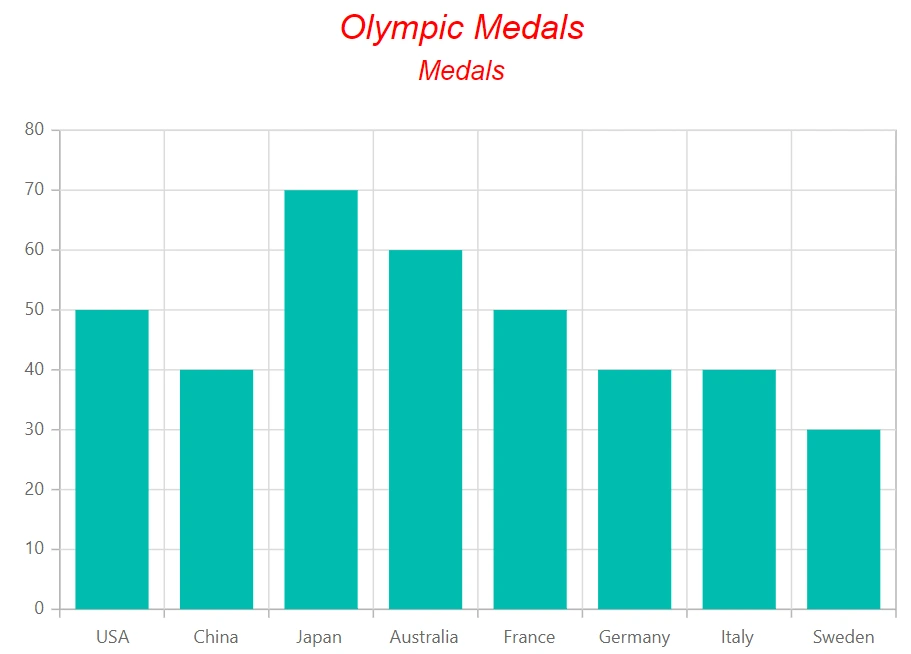
The [SubTitle](https://help.syncfusion.com/cr/blazor/Syncfusion.Blazor.Charts.SfChart.html#Syncfusion_Blazor_Charts_SfChart_SubTitle) property can be used to add a subtitle to the chart in-order to provide additional information about the data displayed.
```cshtml
@using Syncfusion.Blazor.Charts
@code{
public class ChartData
{
public string Country { get; set; }
public double Gold { get; set; }
}
public List MedalDetails = new List
{
new ChartData{ Country= "USA", Gold=50 },
new ChartData{ Country="China", Gold=40 },
new ChartData{ Country= "Japan", Gold=70 },
new ChartData{ Country= "Australia", Gold=60},
new ChartData{ Country= "France", Gold=50 },
new ChartData{ Country= "Germany", Gold=40 },
new ChartData{ Country= "Italy", Gold=40 },
new ChartData{ Country= "Sweden", Gold=30 }
};
}
```
N> The chart components do not use any CSS style for customization; chart elements like axis labels, datalabel, background, series palette, legend text, and tooltip text can be customized by using the [ChartAxisLabelStyle](https://help.syncfusion.com/cr/blazor/Syncfusion.Blazor.Charts.ChartAxisLabelStyle.html), [ChartDataLabelFont](https://help.syncfusion.com/cr/blazor/Syncfusion.Blazor.Charts.ChartDataLabelFont.html), [BackGround](https://help.syncfusion.com/cr/blazor/Syncfusion.Blazor.Charts.SfChart.html#Syncfusion_Blazor_Charts_SfChart_Background), [Palettes](https://help.syncfusion.com/cr/blazor/Syncfusion.Blazor.Charts.SfChart.html#Syncfusion_Blazor_Charts_SfChart_Palettes), [ChartLegendTextStyle](https://help.syncfusion.com/cr/blazor/Syncfusion.Blazor.Charts.ChartLegendTextStyle.html), and [ChartTooltipTextStyle](https://help.syncfusion.com/cr/blazor/Syncfusion.Blazor.Charts.ChartTooltipTextStyle.html), respectively.
## See also
* [Data Label](./data-labels)
* [Tooltip](./tool-tip)