Conditional Formatting in Windows Forms GridGrouping
21 Jan 202521 minutes to read
GridGroupingControl provides built-in support for Conditional Formatting. It is used to format grid cells based on a certain conditions. The conditional formatting can be added to the GridGroupingControl by defining the GridConditionalFormatDescriptor. This descriptor is used to specify the filter criteria for the cells and the style to be applied for filtered cells.
The following steps are used to add the conditional formatting through the editor,
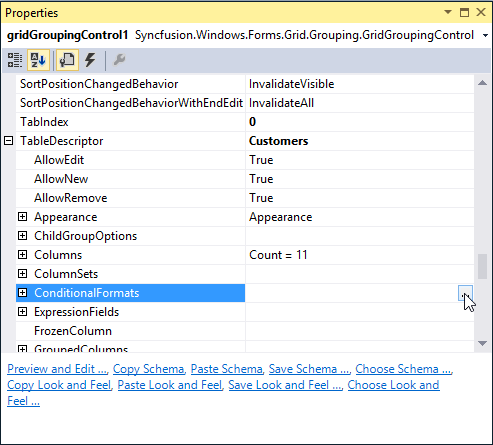
- Navigate the Property window of GridGroupingControl to the TableDescriptor -> ConditionalFormats and click the browse button to open the
GridConditionalColumnDescriptorcollection editor,
-
Click the
Addbutton of the editor. It will add a new conditional format to the collection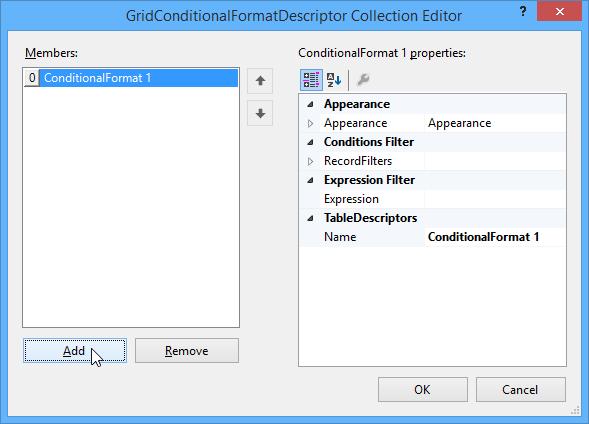
-
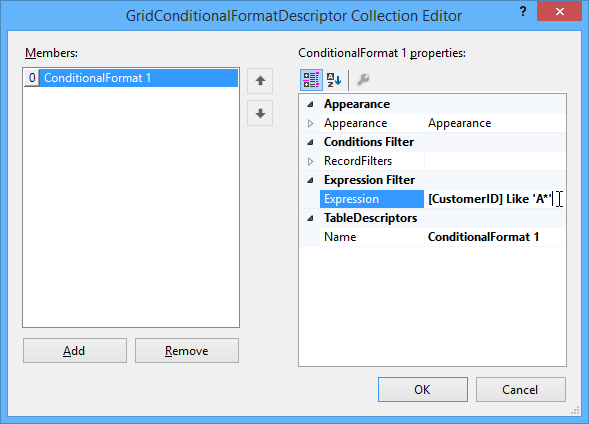
Add the expression to the Expression filed option. (Ex: [ColumnName] like ‘A*’)
-
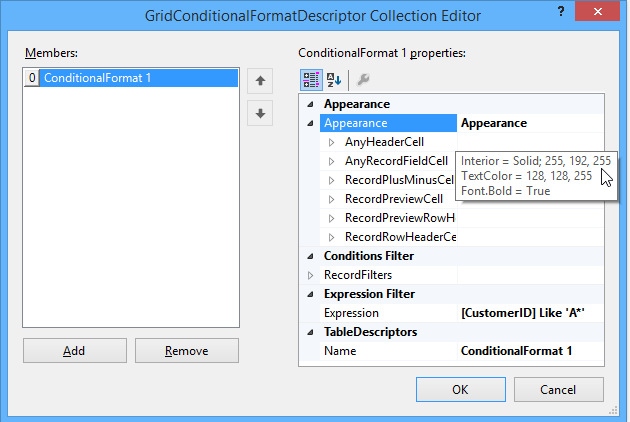
Set the style for the records that satisfies the filter criteria by using the Appearance option
-
Click the
OKbutton and run the application. The conditional formatting will be applied to the records as of follows,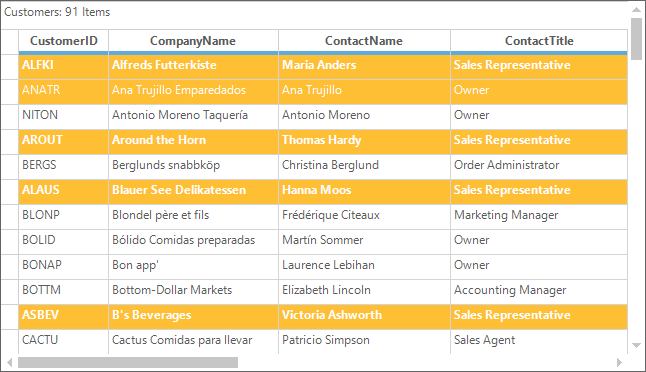
Programmatic Conditional Formatting
The conditional formatting can be programmatically added to the GridGroupingControl by defining the GridConditionalFormatDescriptor collection. It can be used to add the number of formatters to set the filter criteria and appearance. The filter criteria can be specified either by adding RecordFilters or by an Expression.
//Define Conditional Format Descriptor and specify filter criteria and style to be applied.

//Applies the following style to the records whose CustomerID starts with 'A'.
GridConditionalFormatDescriptor format1 = new GridConditionalFormatDescriptor();
format1.Appearance.AnyRecordFieldCell.Interior = new BrushInfo(Color.FromArgb(255, 191, 52));
format1.Appearance.AnyRecordFieldCell.TextColor = Color.White;
format1.Expression = "[CustomerID]  LIKE \'A*\'";
format1.Name = "ConditionalFormat 1";

//Applies the following style to the records whose ContactTitle = 'Sales Representative'.
GridConditionalFormatDescriptor format2 = new GridConditionalFormatDescriptor();
format2.Appearance.AnyRecordFieldCell.Font.Bold = true;
format2.Appearance.AnyRecordFieldCell.Interior = new BrushInfo(Color.FromArgb(102, 110, 152));
format2.Appearance.AnyRecordFieldCell.TextColor = Color.White;
format2.Expression = "[ContactTitle] LIKE \'Sales Representative\'";
format2.Name = "ConditionalFormat 2";

// Add the descriptor to the TableDescriptor.ConditionalFormats property.
this.gridGroupingControl1.TableDescriptor.ConditionalFormats.Add(format1);
this.gridGroupingControl1.TableDescriptor.ConditionalFormats.Add(format2);
'Define Conditional Format Descriptor and specify filter criteria and style to be applied.
'Applies the following style to the records whose CustomerID starts with 'A'.
Dim format1 As New GridConditionalFormatDescriptor()
format1.Appearance.AnyRecordFieldCell.Interior = New BrushInfo(Color.FromArgb(255, 191, 52))
format1.Appearance.AnyRecordFieldCell.TextColor = Color.White
format1.Expression = "[CustomerID] LIKE 'A*'"
format1.Name = "ConditionalFormat 1"
'Applies the following style to the records whose ContactTitle = 'Sales Representative'.
Dim format2 As New GridConditionalFormatDescriptor()
format2.Appearance.AnyRecordFieldCell.Font.Bold = True
format2.Appearance.AnyRecordFieldCell.Interior = New BrushInfo(Color.FromArgb(102, 110, 152))
format2.Appearance.AnyRecordFieldCell.TextColor = Color.White
format2.Expression = "[ContactTitle] LIKE 'Sales Representative'"
format2.Name = "ConditionalFormat 2"
'Add the descriptor to the TableDescriptor.ConditionalFormats property.
Me.gridGroupingControl1.TableDescriptor.ConditionalFormats.Add(format1)
Me.gridGroupingControl1.TableDescriptor.ConditionalFormats.Add(format2)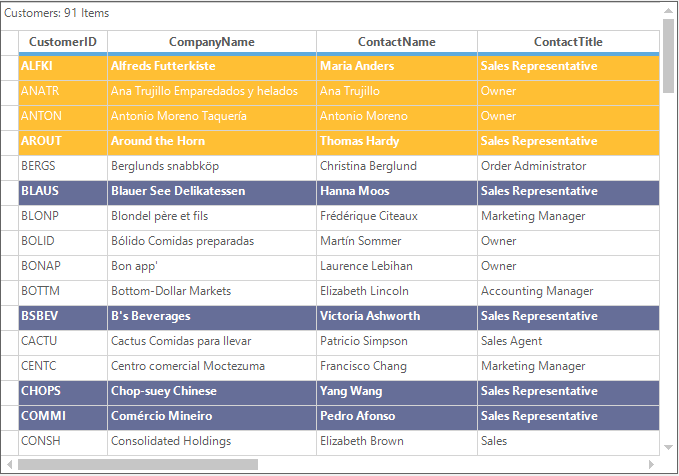
NOTE
The conditional formatting is implemented in the following dashboard sample,
<Install_Location>\Syncfusion\EssentialStudio[Version_Number]\Windows\Grid.Grouping.Windows\Samples\Styling and Formatting\Conditional Formatting Demo
Formatting Preview Rows
The appearance of the record preview row can be customized by using the conditional formatting.
//Enable Record Preview Rows
this.gridGroupingControl1.TableOptions.ShowRecordPreviewRow = true;

GridConditionalFormatDescriptor conditionalFormat1 = new GridConditionalFormatDescriptor();
conditionalFormat1.Appearance.RecordPreviewCell.Interior = new BrushInfo(Color.FromArgb(255, 191, 52));
conditionalFormat1.Expression = "[City]  Like \'L*\' ";

GridConditionalFormatDescriptor conditionalFormat2 = new GridConditionalFormatDescriptor();
conditionalFormat2.Appearance.RecordPreviewCell.Interior = new BrushInfo(Color.FromArgb(102, 110, 152));
conditionalFormat2.Expression = "[CompanyName]  Like \'A*\' ";

//Adding conditional format to the grid
this.gridGroupingControl1.TableDescriptor.ConditionalFormats.Add(conditionalFormat1);
this.gridGroupingControl1.TableDescriptor.ConditionalFormats.Add(conditionalFormat2);
'Enable Record Preview Rows
Me.gridGroupingControl1.TableOptions.ShowRecordPreviewRow = True
Dim conditionalFormat1 As New GridConditionalFormatDescriptor()
conditionalFormat1.Appearance.RecordPreviewCell.Interior = New BrushInfo(Color.FromArgb(255, 191, 52))
conditionalFormat1.Expression = "[City] Like 'L*' "
Dim conditionalFormat2 As New GridConditionalFormatDescriptor()
conditionalFormat2.Appearance.RecordPreviewCell.Interior = New BrushInfo(Color.FromArgb(102, 110, 152))
conditionalFormat2.Expression = "[CompanyName] Like 'A*' "
'Adding conditional format to the grid
Me.gridGroupingControl1.TableDescriptor.ConditionalFormats.Add(conditionalFormat1)
Me.gridGroupingControl1.TableDescriptor.ConditionalFormats.Add(conditionalFormat2)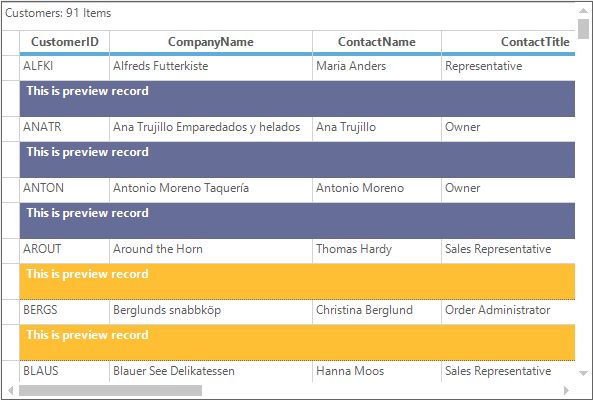
Formatting Based on Checkbox Value
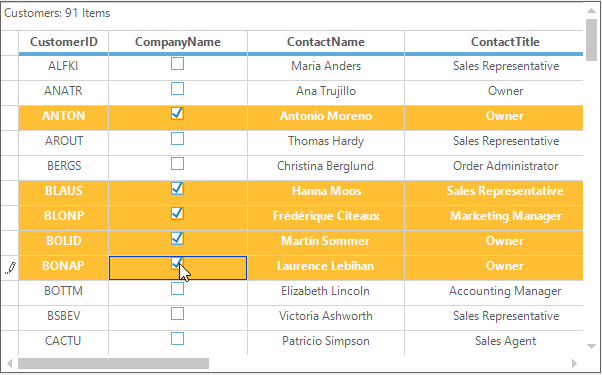
The back color of the record can be changed dynamically based on the checkbox value of the particular column. The following code snippet is demonstrates how to add the filter criteria for check box column,
//Setting the Checkbox column
this.gridGroupingControl1.TableDescriptor.Columns["CompanyName"].Appearance.AnyRecordFieldCell.CellType = "CheckBox";

GridConditionalFormatDescriptor format1 = new GridConditionalFormatDescriptor();
format1.Appearance.AnyRecordFieldCell.Interior = new BrushInfo(Color.FromArgb(255, 191, 52));
format1.Appearance.AnyRecordFieldCell.TextColor = Color.White;
format1.Expression = "[CompanyName]  Like \'true\'";
format1.Name = "ConditionalFormat 1";

// Add the descriptor to the TableDescriptor.ConditionalFormats property.
this.gridGroupingControl1.TableDescriptor.ConditionalFormats.Add(format1);
'Setting the Checkbox column
Me.gridGroupingControl1.TableDescriptor.Columns("CompanyName").Appearance.AnyRecordFieldCell.CellType = "CheckBox"
Dim format1 As New GridConditionalFormatDescriptor()
format1.Appearance.AnyRecordFieldCell.Interior = New BrushInfo(Color.FromArgb(255, 191, 52))
format1.Appearance.AnyRecordFieldCell.TextColor = Color.White
format1.Expression = "[CompanyName] Like 'true'"
format1.Name = "ConditionalFormat 1"
' Add the descriptor to the TableDescriptor.ConditionalFormats property.
Me.gridGroupingControl1.TableDescriptor.ConditionalFormats.Add(format1)After applying the conditional formatting the color will be changed for the records which are checked in the check box field.
Dynamic Formatting
The cells can be formatted dynamically based on the given condition by using the QueryCellStyleInfo event. The appearance of the cells can be changed dynamically by using this formatting.
this.gridGroupingControl1.QueryCellStyleInfo += new GridTableCellStyleInfoEventHandler(gridGroupingControl1_QueryCellStyleInfo);
void gridGroupingControl1_QueryCellStyleInfo(object sender, GridTableCellStyleInfoEventArgs e)
{

    if (e.Style.Text.StartsWith("A"))
    {
        e.Style.BackColor = Color.LightGreen;
    }
}
AddHandler gridGroupingControl1.QueryCellStyleInfo, AddressOf gridGroupingControl1_QueryCellStyleInfo
Private Sub gridGroupingControl1_QueryCellStyleInfo(ByVal sender As Object, ByVal e As GridTableCellStyleInfoEventArgs)
If e.Style.Text.StartsWith("A") Then
e.Style.BackColor = Color.LightGreen
End If
End Sub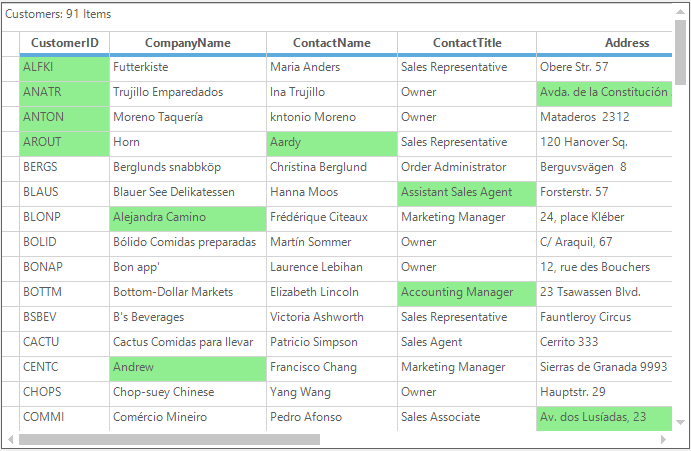
Data Bar
Data bar is an Excel Inspired Data bar which is used to visualize the negative and positive values of the column in a different range of colors. The data bars will be drawn based on the criteria given in the expression of the ConditionalFormats.
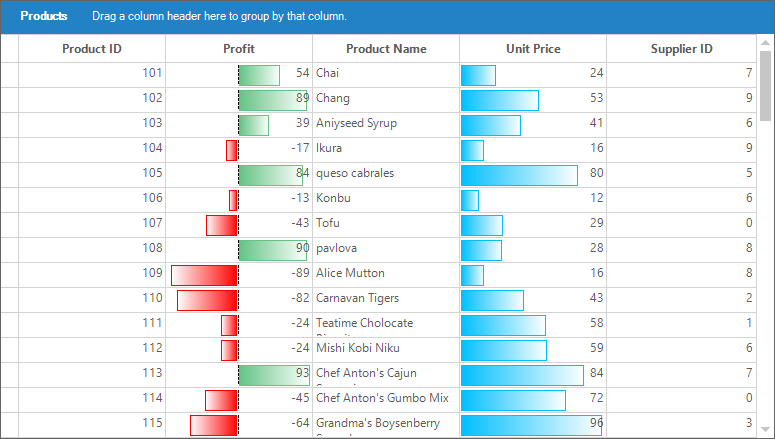
The following steps can be followed to add the data bar through the editor,
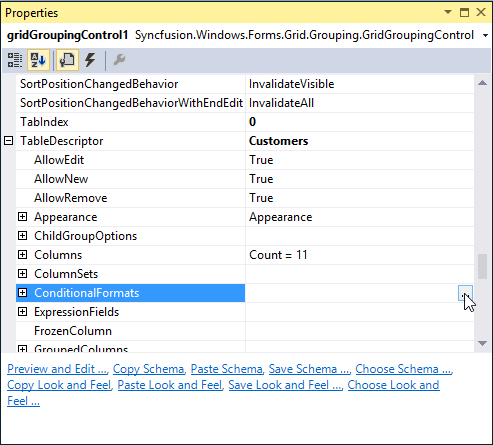
1.Navigate the Property window of GridGroupingControl to the TableDescriptor -> ConditionalFormats and click the browse button to open the GridConditionalFormatDescriptor collection editor.
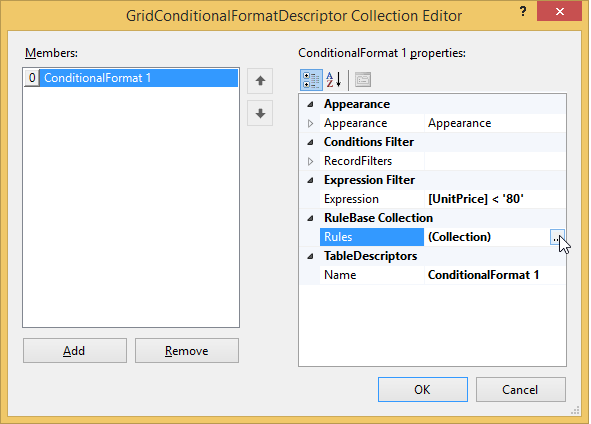
2.In the GridConditionalFormatDescriptor Collection Editor, any expression can be added to the Expression field for drawing the data bars within that criteria. (Ex: [UnitPrice] < ‘80’) With this expression, no data bar will be drawn in the record if the cell value of the UnitPrice column will be greater than 80.
Then, Navigate into the GridConditionalFormatDescriptor collection editor window and select the Rules property to open the Rule Collection Editor window.
NOTE
Data bar can also be drawn without expression.
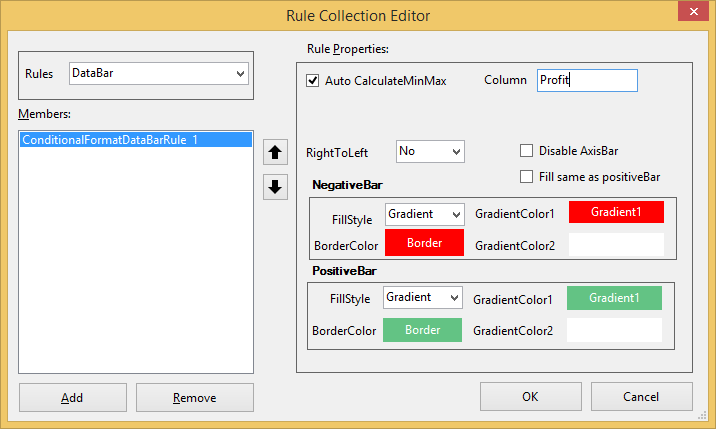
3.Choose the rule type as DataBar and click Add button, it will add a newConditionalFormatDataBarRule to the ConditionalFormatRuleBaseCollection. Set the column name and style for data bar rule.
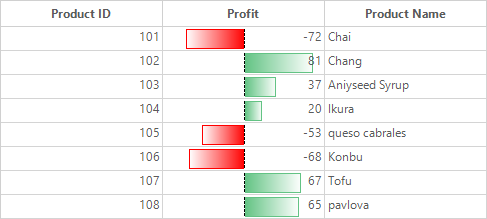
Click the OK button to add the ConditionalFormatDataBarRule to the conditional format collection. And, the data bar for the Unit Price column will be displayed as follows,
Programmatically Adding Data bar
The data bar rule can be added programmatically by defining ConditionalFormatDataBarRule and assigning it to the GridConditionalFormatDescriptor.
//Initialize the GridConditionalFormatDescriptor and ConditionalFormatDataBarRule.
GridConditionalFormatDescriptor conditionalDescriptor = new GridConditionalFormatDescriptor();

//object for data bar rule
ConditionalFormatDataBarRule conditionDataBarRule1 = new ConditionalFormatDataBarRule();

//Assigning column for data bar
conditionDataBarRule1.ColumnName = "Profit";

//Adding the rule to rules collection
conditionalDescriptor.Rules.Add(conditionDataBarRule1);

//Adding descriptor.
this.gridGroupingControl1.TableDescriptor.ConditionalFormats.Add(conditionalDescriptor);
'Initialize the GridConditionalFormatDescriptor and ConditionalFormatDataBarRule.
Dim conditionalDescriptor As New GridConditionalFormatDescriptor()
'object for data bar rule
Dim conditionDataBarRule1 As New ConditionalFormatDataBarRule()
'Assigning column for data bar
conditionDataBarRule1.ColumnName = "Profit"
'Adding the rule to rules collection
conditionalDescriptor.Rules.Add(conditionDataBarRule1)
'Adding descriptor.
Me.gridGroupingControl1.TableDescriptor.ConditionalFormats.Add(conditionalDescriptor)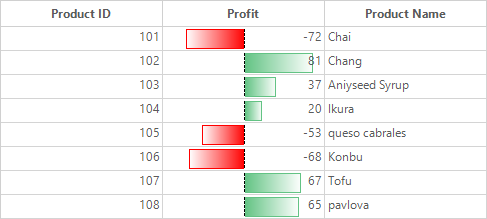
Calculating Minimum and Maximum values
The length of the data bar will be drawn based on the minimum and maximum value of the column. These minimum and maximum values can be calculated automatically if the ConditionalFormatDataBarRule.AutoCalculateMinMax is set to true. This is the default value.
Minimum and maximum values can also be defined through ConditionalFormatDataBarRule.Maximum and ConditionalFormatDataBarRule.Minimum by disabling the ConditionalFormatDataBarRule.AutoCalculateMinMax property
NOTE
If
ConditionalFormatDataBarRule.AutoCalculateMinMaxis set asfalse, then it is mandatory to assign values forConditionalFormatDataBarRule.Maximum,ConditionalFormatDataBarRule.Minimum.
ConditionalFormatDataBarRule dataBarRule = new ConditionalFormatDataBarRule();

//setting automatic calculation enable or disable.
dataBarRule.AutoCalculateMinMax = false;

//Setting Maximum and minimum values
dataBarRule.Maximum = 50;
dataBarRule.Minimum = -10;
Dim dataBarRule As New ConditionalFormatDataBarRule()
'setting automatic calculation enable or disable.
dataBarRule.AutoCalculateMinMax = False
'Setting Maximum and minimum values
dataBarRule.Maximum = 50
dataBarRule.Minimum = -10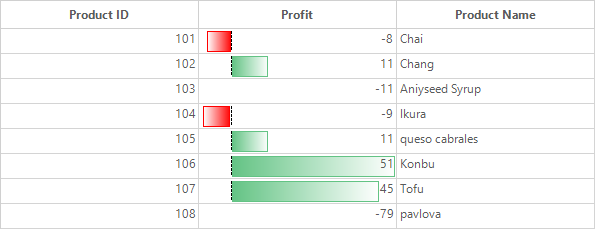
Default Colors of Positive and Negative bars
If no colors assigned for positive and negative bars, it will take the below default color values.
ConditionalFormatDataBarRule dataBarRule = new ConditionalFormatDataBarRule();

//Setting appearance for Positive cells.
dataBarRule.PositiveBar.FillStyle = FillStyles.Gradient;
dataBarRule.PositiveBar.GradientFillColor1 = Color.FromArgb(255, 99, 195, 132);
dataBarRule.PositiveBar.GradientFillColor2 = Color.FromArgb(255, 255, 255);
dataBarRule.PositiveBar.BorderColor = conditionDataBarRule2.PositiveBar.GradientFillColor1;

//Setting appearance for Negative cells.
dataBarRule.NegativeBar.FillStyle = FillStyles.Gradient;
dataBarRule.NegativeBar.GradientFillColor1 = Color.Red;
dataBarRule.NegativeBar.GradientFillColor2 = Color.FromArgb(255, 255, 255);
dataBarRule.NegativeBar.BorderColor = Color.Red;
Dim dataBarRule As New ConditionalFormatDataBarRule()
'Setting appearance for Positive cells.
dataBarRule.PositiveBar.FillStyle = FillStyles.Gradient
dataBarRule.PositiveBar.GradientFillColor1 = Color.DeepSkyBlue
dataBarRule.PositiveBar.GradientFillColor2 = Color.FromArgb(255, 255, 255)
dataBarRule.PositiveBar.BorderColor = conditionDataBarRule2.PositiveBar.GradientFillColor1
'Setting appearance for Negative cells.
dataBarRule.NegativeBar.FillStyle = FillStyles.Gradient
dataBarRule.NegativeBar.GradientFillColor1 = Color.Red
dataBarRule.NegativeBar.GradientFillColor2 = Color.FromArgb(255, 255, 255)
dataBarRule.NegativeBar.BorderColor = Color.Red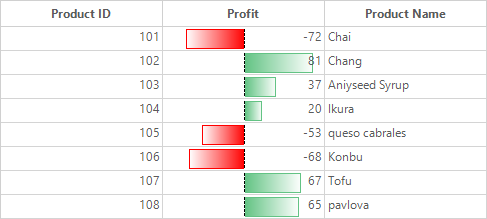
Setting Positive and Negative bar Colors
The border color, fill color and fill style can be changed for positive and negative bars. The fill style can be Solid or Gradient.
Applying Solid color
To apply solid fill color for data bars, it is necessary to choose ConditionalFormatDataBarRule.FillStyle as Solid from FillStyle option.
//Initialize the GridConditionalFormatDescriptor and ConditionalFormatDataBarRule.
GridConditionalFormatDescriptor ConditionalDescriptor1 = new GridConditionalFormatDescriptor();
ConditionalFormatDataBarRule dataBarRule = new ConditionalFormatDataBarRule();

//Setting appearance for Positive cells.
dataBarRule.PositiveBar.FillStyle = FillStyle.Solid;
dataBarRule.PositiveBar.SolidFillColor = Color.Purple;
dataBarRule.PositiveBar.BorderColor = Color. Purple;

//Setting appearance for Negative cells.
dataBarRule.NegativeBar.FillStyle = FillStyle.Solid;
dataBarRule.NegativeBar.SolidFillColor = Color.Orange;
dataBarRule.NegativeBar.BorderColor = Color.Orange;

//Adding DataBar Rule to the ConditionalFormatDescriptor.
ConditionalDescriptor1.Rules.Add(dataBarRule);

//Adding GridConditionalFormatDescriptor to GridGroupingControl.
this.gridGroupingControl1.TableDescriptor.ConditionalFormats.Add(ConditionalDescriptor1);
'Initialize the GridConditionalFormatDescriptor and ConditionalFormatDataBarRule.
Dim ConditionalDescriptor1 As New GridConditionalFormatDescriptor()
Dim dataBarRule As New ConditionalFormatDataBarRule()
'Setting appearance for Positive cells.
dataBarRule.PositiveBar.FillStyle = FillStyle.Solid
dataBarRule.PositiveBar.SolidFillColor = Color.Purple
dataBarRule.PositiveBar.BorderColor = Color.Purple
'Setting appearance for Negative cells.
dataBarRule.NegativeBar.FillStyle = FillStyle.Solid
dataBarRule.NegativeBar.SolidFillColor = Color.Orange
dataBarRule.NegativeBar.BorderColor = Color.Orange
'Adding DataBar Rule to the ConditionalFormatDescriptor.
ConditionalDescriptor1.Rules.Add(dataBarRule)
'Adding GridConditionalFormatDescriptor to GridGroupingControl.
Me.gridGroupingControl1.TableDescriptor.ConditionalFormats.Add(ConditionalDescriptor1)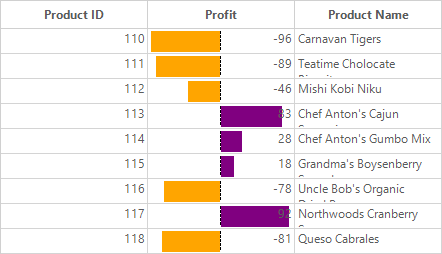
Applying Gradient Fill Colors
Choose FillStyle as Gradient to apply gradient colors for both positive and negative bars.
//Initialize the GridConditionalFormatDescriptor and ConditionalFormatDataBarRule.
GridConditionalFormatDescriptor ConditionalDescriptor1 = new GridConditionalFormatDescriptor();
ConditionalFormatDataBarRule dataBarRule = new ConditionalFormatDataBarRule();

//Setting appearance for Positive cells.
dataBarRule.PositiveBar.FillStyle = FillStyle.Gradient;
dataBarRule.PositiveBar.GradientFillColor1 = Color.Purple;
dataBarRule.PositiveBar.GradientFillColor2 = Color.FromArgb(255, 255, 255);
dataBarRule.PositiveBar.BorderColor = Color.Purple;

//Setting appearance for Negative cells.
dataBarRule.NegativeBar.FillStyle = FillStyle.Gradient;
dataBarRule.NegativeBar.GradientFillColor1 = Color.Orange;
dataBarRule.NegativeBar.GradientFillColor2 = Color.FromArgb(255, 255, 255);
dataBarRule.NegativeBar.BorderColor = Color.Orange;

//Adding DataBar Rule to the ConditionalFormatDescriptor.
ConditionalDescriptor1.Rules.Add(conditionDataBarRule1);

//Adding GridConditionalFormatDescriptor to GridGroupingControl.
this.gridGroupingControl1.TableDescriptor.ConditionalFormats.Add(ConditionalDescriptor1);
'Initialize the GridConditionalFormatDescriptor and ConditionalFormatDataBarRule.
Dim ConditionalDescriptor1 As New GridConditionalFormatDescriptor()
Dim dataBarRule As New ConditionalFormatDataBarRule()
'Setting appearance for Positive cells.
dataBarRule.PositiveBar.FillStyle = FillStyle.Gradient
dataBarRule.PositiveBar.GradientFillColor1 = Color.Purple
dataBarRule.PositiveBar.GradientFillColor2 = Color.FromArgb(255, 255, 255)
dataBarRule.PositiveBar.BorderColor = Color.Purple
'Setting appearance for Negative cells.
dataBarRule.NegativeBar.FillStyle = FillStyle.Gradient
dataBarRule.NegativeBar.GradientFillColor1 = Color.Orange
dataBarRule.NegativeBar.GradientFillColor2 = Color.FromArgb(255, 255, 255)
dataBarRule.NegativeBar.BorderColor = Color.Orange
'Adding DataBar Rule to the ConditionalFormatDescriptor.
ConditionalDescriptor1.Rules.Add(conditionDataBarRule1)
'Adding GridConditionalFormatDescriptor to GridGroupingControl.
Me.gridGroupingControl1.TableDescriptor.ConditionalFormats.Add(ConditionalDescriptor1)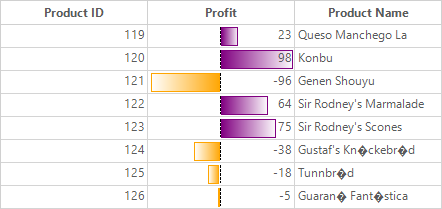
Filling Negative bar Color as Same as Positive bar
When the ConditionalFormatDataBarRule.FillNegativeColorAsPositive is enabled, then the positive bar FillStyle, SolidFillColor, GradientColors, BorderColor are copied to negative bar.
//Applying same color for negative Bar as like positive.
dataBarRule.FillNegativeColorSameAsPositive = true;
'Applying same color for negativeBar cell as like positive.
dataBarRule.FillNegativeColorSameAsPositive = True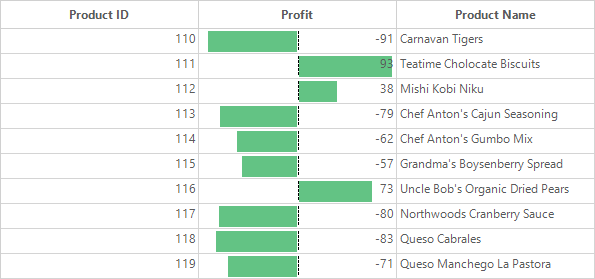
Disabling Axis
The axis between positive and negative bars can be disabled or enabled by using ConditionalFormatDataBarRule.AxisPosition property.
Automatic – Axis position will be assigned based on the highest minimum value.
None - Draws both negative and positive in the same direction.
// calculates axis position based on particular column minimum and maximum values.
dataBarRule.AxisPosition = AxisPosition.None;
'Calculates axis bar position based on particular column minimum and maximum values.
dataBarRule.AxisPosition = AxisPosition.None;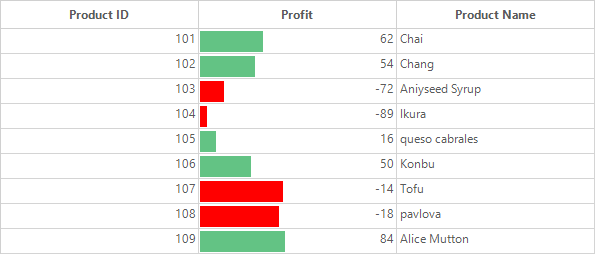
Applying Axis Color
Axis color can be changed by using ConditionalFormatDataBarRule.AxisColor property. Default color is Black.
//Apply color to the axis bar.
conditionDataBarRule1.AxisColor = Color.Red;
'Apply color to the axis bar.
conditionDataBarRule1.AxisColor = Color.Red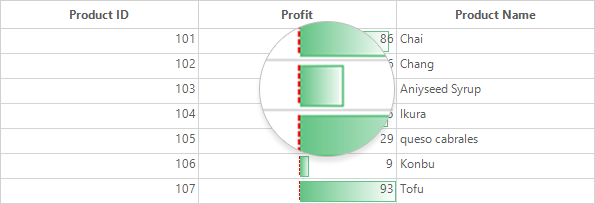
Getting Rule through Column Name
The rule applied for the specific column can be retrieved by using the GridConditionalFormatDescriptor.GetRule method.
//Getting conditional format descriptor.
GridConditionalFormatDescriptor conditionalDescriptor = this.gridGroupingControl1.TableDescriptor.ConditionalFormats[0];

 // Gets the rule applied to the Unit Price column.
ConditionalFormatDataBarRule  rule = conditionalDescriptor.GetRule("UnitPrice") as ConditionalFormatDataBarRule;
'Getting conditional format descriptor.
Dim conditionalDescriptor As GridConditionalFormatDescriptor = Me.gridGroupingControl1.TableDescriptor.ConditionalFormats(0)
' Gets the rule applied to the Unit Price column.
Dim rule As ConditionalFormatDataBarRule = TryCast(conditionalDescriptor.GetRule("UnitPrice"), ConditionalFormatDataBarRule)Using Expressions
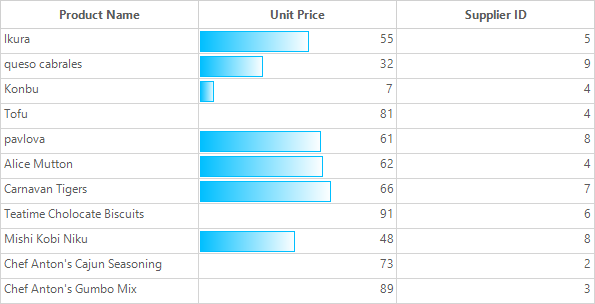
The data bar can be used in two ways, one is with GridConditionalFormatDescriptor.Expression Filter condition; another one is without expression condition.
While having GridConditionalFormatDescriptor.Expression Filter condition for records, data bar will be drawn only on the filtered records.
When there is no expression, data bar will be drawn for all the cell values in that particular column.
//Initialize the GridConditionalFormatDescriptor and ConditionalFormatDataBarRule.
GridConditionalFormatDescriptor ConditionalDescriptor1 = new Syncfusion.Windows.Forms.Grid.Grouping.GridConditionalFormatDescriptor();

//Define Expression for GridConditionalFormatDescriptor.
gridConditionalFormatDescriptor1.Expression = "[UnitPrice] > '0' AND [UnitPrice] < '70' ";

//Adding ConditionalFormatDescriptor with ConditionalFormats collection
this.gridGroupingControl1.TableDescriptor.ConditionalFormats.Add(ConditionalDescriptor1);
'Initialize the GridConditionalFormatDescriptor and ConditionalFormatDataBarRule.
Dim gridConditionalFormatDescriptor1 As New Syncfusion.Windows.Forms.Grid.Grouping.GridConditionalFormatDescriptor()
'Define Expression for GridConditionalFormatDescriptor.
gridConditionalFormatDescriptor1.Expression = "[UnitPrice] > '0' AND [UnitPrice] < '70' "
'Adding GridConditionalFormatDescriptor with TableDescriptor.ConditionalFormats collection
Me.gridGroupingControl1.TableDescriptor.ConditionalFormats.Add(gridConditionalFormatDescriptor1)Data bar is drawn based on the expression [UnitPrice] > '0' AND [UnitPrice] < '70'
Removing Data Bar
Data Bar can be cleared by removing ConditionalFormatDataBarRule objects from ConditionalFormatRuleBaseCollection.
//Getting conditional format descriptor.
GridConditionalFormatDescriptor conditionalDescriptor = this.gridGroupingControl1.TableDescriptor.ConditionalFormats[0];

 // Get the rule applied to the Unit Price column.
ConditionalFormatDataBarRule  rule = conditionalDescriptor.GetRule("UnitPrice") as ConditionalFormatDataBarRule;

//Removing conditionalFormatDataBarRule
conditionalDescriptor.Rules.Remove(rule);
Dim conditionalDescriptor As GridConditionalFormatDescriptor = Me.gridGroupingControl1.TableDescriptor.ConditionalFormats(0)
' Get the rule applied to the Unit Price column.
Dim rule As ConditionalFormatDataBarRule = TryCast(conditionalDescriptor.GetRule("UnitPrice"), ConditionalFormatDataBarRule)
'Removing conditionalFormatDataBarRule
conditionalDescriptor.Rules.Remove(rule)