Getting Started
8 Jan 201812 minutes to read
This section explains briefly about how to create a RangeNavigator in your application with JavaScript.
Create your first RangeNavigator in JavaScript
This section encompasses on how to configure the ejRangeNavigator and update the chart control for RangeNavigator’s selected range. It also helps you to learn how to pass the required data to RangeNavigator and customize the scale and selected range for your requirements. In this example, you will look at the steps to configure a RangeNavigator to analyze sales of a product for a particular quarter in a year.
Configure ejRangeNavigator
Getting started with your ejRangeNavigator is simple. You can initialize the ejRangeNavigator by setting its range values.
You can create an HTML file as shown in the following code example.
<!DOCTYPE html>
<html>
<head>
<script src="http://cdn.syncfusion.com/js/assets/external/jquery-1.10.2.min.js" type="text/javascript"></script>
<script src="http://ajax.aspnetcdn.com/ajax/globalize/0.1.1/globalize.min.js"></script>
<script src="http://cdn.syncfusion.com/28.1.33/js/web/ej.web.all.min.js" type="text/javascript"></script>
</head>
<body></body>
</html>- Create a <div> tag with an id.
<body>
<div id="rangecontainer"  ></div>
</body>- Add a script tag inside the <Body> tag and add the following code example.
The following code example renders a RangeNavigator with a range from 2010, January 1st to December 31st.
<script type="text/javascript" language="javascript">
$(function () {
$("#container").ejRangeNavigator({
rangeSettings: {
start: "2010/1/1", end: "2010/12/31"
},
});
});
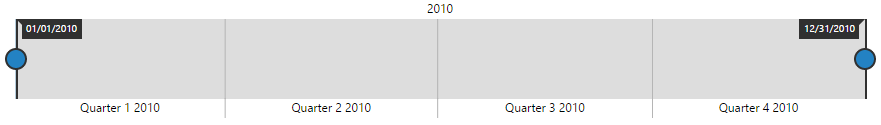
</script>The following screen shot displays the RangeNavigator with a range from 2010, January 1st to December 31st.
Add series
To add series to ejRangeNavigator, you need to set dataSource property of ejRangeNavigator as shown in the following code example.
You can create data source for RangeNavigator as follows.
window.chartData = [{ "xDate": new Date(2011, 0, 1), "yValue": 10 },
                        { "xDate": new Date(2011, 2, 1), "yValue": 5 },
                        { "xDate": new Date(2011, 4, 1), "yValue": 15 },
                        { "xDate": new Date(2011, 6, 1), "yValue": 25 },
                        { "xDate": new Date(2011, 8, 1), "yValue": 10 },
                        { "xDate": new Date(2011, 10, 1), "yValue": 5 },
                        { "xDate": new Date(2011, 12, 1), "yValue": 15 }];
Now, add the dataSource to the RangeNavigator and provide the field name to get the values from the dataSource in xName and yName options.
$(function () {
$("#container").ejRangeNavigator({
dataSource: window.chartData, xName: "xDate", yName: "yValue"
});
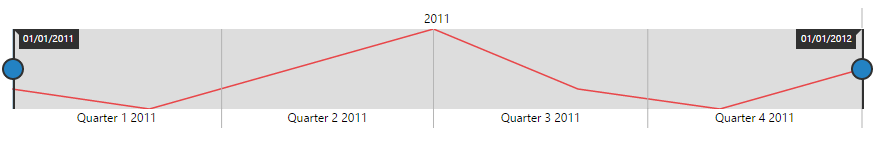
});The following screenshot displays a RangeNavigator with the default “Line” series type. To change the line segment color, you can use the fill property of the series.
Enable tooltip
You can customize Tooltip for RangeNavigator using tooltipSettings option. You can use tooltipDisplayMode option in tooltipSettings,to display the tooltip “always” or “ondemand” (displays tooltip only while dragging the sliders). You can also specify label format for tooltip using labelFormat.
The following code sample shows how to enable a Tooltip.
$(function () {
$("#container").ejRangeNavigator({
//…
tooltipSettings: {
visible: true, labelFormat: "MMM/YYYY", tooltipDisplayMode: "always",
},
//...
});
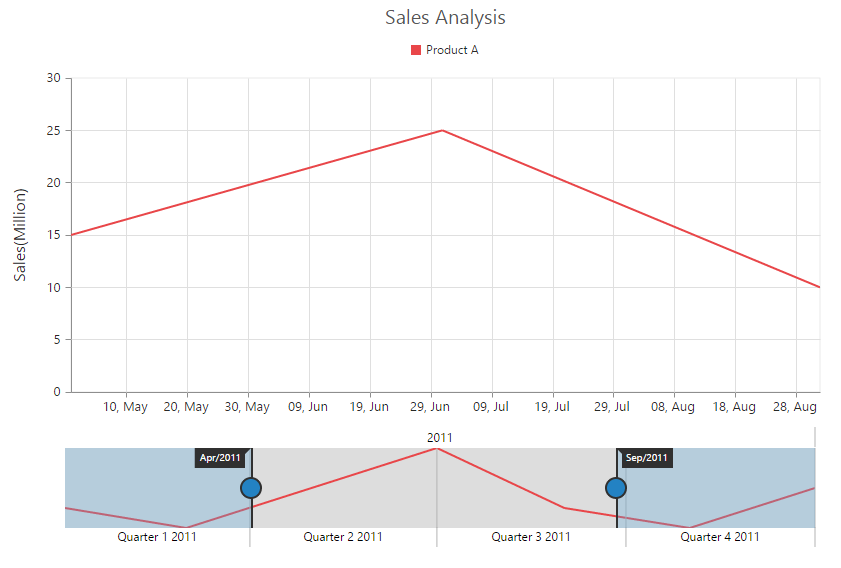
});The following screenshot displays the label format tooltipSettings* in RangeNavigator:
Update Chart
You can use ejRangeNavigator with controls such as chart and grid to view the range of data selected in ejRangeNavigator.
In order to update chart, whenever the selected range changes in ejRangeNavigator, you need to use rangeChanged event of ejRangeNavigator and then update the chart with the selected data in this event.
You can create a chart with line series using the following code sample.
- Create a <div> tag with an id.
<body>
<div id=" chartContent "></div>
</body>- Add a script tag inside the body tag and add the following code sample.
<body>
<script type="text/javascript" language="javascript ">
$(function () {
      $("#chartContent").ejChart(
      {
         title:{ text:"Sales Analysis"},
         legend: { visible: true, position: 'top' },
         primaryYAxis: {
                    title: { text: "Sales(Million)" }
                },
         series: [
           {
             name: 'Product A', type: 'line',
             dataSource: window.chartData, xName: "xDate", yName: "yValue"
           }
         ],
       });
   });
</script>
</body>
You can update the chart with the selected data using the rangeChanged event of ejRangeNavigator.
$("#container").ejRangeNavigator({
//...
dataSource: window.chartData, xName: "xDate", yName: "yValue" ,
rangeChanged: "onRangeChanged",
//...
});
function onRangeChanged(sender) {
var chartObj = $("#chartContent").data("ejChart");
if (chartObj != null) {
chartObj.model.series[0].dataSource = sender.selectedData;
$("#chartContent").ejChart("redraw");
}
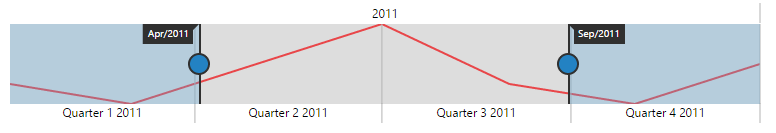
}The following screenshot displays how a RangeNavigator is updated when a selected range is changed.

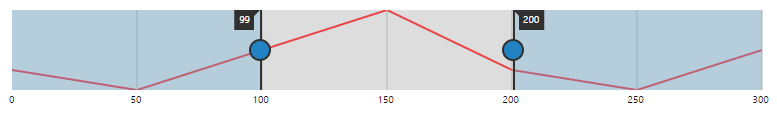
Set value type
ejRangeNavigator can also be used with numerical values. You can specify the data type using valueType option.
You can create a dataSource and get the values from the datasource in xName and yName options for Chart Series with integer Values using the following code sample.
window.chartData = [
    { "xDate": 0, "yValue": 10 },
    { "xDate": 50, "yValue": 5 },
    { "xDate": 100, "yValue": 15 },
    { "xDate": 150, "yValue": 25 },
    { "xDate": 200, "yValue": 10 },
    { "xDate": 250, "yValue": 5 },
    { "xDate": 300, "yValue": 15 },
    ];
Now, you can set the dataSource for Chart Series and valueType property to “numeric” as given in the following code example.
$(function () {
          $("#container").ejRangeNavigator({
            series: [
            {
              type: 'line',
              dataSource: window.chartData, xName: "xDate", yName: "yValue"
            }
            ],
            valueType:"numeric",
          });
       });
The following screenshot displays a RangeNavigator with numerical values:
Animation
To animate the series enabled or disabled the animation option by using enableAnimation property.
$(function () {
          $("#container").ejRangeNavigator({
            series: [
            {
              type: 'line',
              dataSource: window.chartData, xName: "xDate", yName: "yValue" ,
              enableAnimation:true,
            }
            ],
            valueType:"numeric",
          });
       });